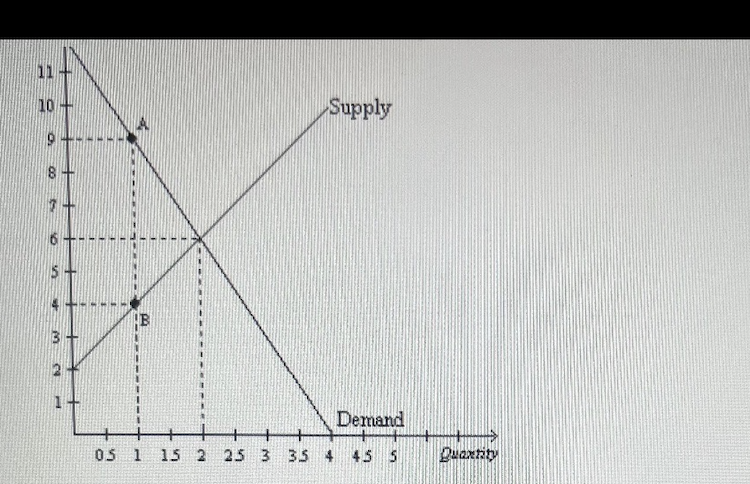
The graph above represent a market with a tax policy. Following the implementation of a tax, some producers opt to exit the market, resulting in a reduction in producer surplus by
The graph above represent a market with a tax policy. Following the implementation of a tax, some producers opt to exit the market, resulting in a reduction in producer surplus by

Managerial Economics: Applications, Strategies and Tactics (MindTap Course List)
14th Edition
ISBN:9781305506381
Author:James R. McGuigan, R. Charles Moyer, Frederick H.deB. Harris
Publisher:James R. McGuigan, R. Charles Moyer, Frederick H.deB. Harris
Chapter14A: The Practice Of Revenue Management
Section: Chapter Questions
Problem 1E

Related questions
Question

Transcribed Image Text:The graph above represent a market with a tax policy. Following the implementation
of a tax, some producers opt to exit the market, resulting in a reduction in producer
surplus by
Transcribed Image Text:10-
O
00
8
7
6
5-
4
M
2
H
05 1
15
2
Supply
Demand
25 3 3.5 4 4.5 5
Quantity
Expert Solution
This question has been solved!
Explore an expertly crafted, step-by-step solution for a thorough understanding of key concepts.

This is a popular solution!

Trending now
This is a popular solution!

Step by step
Solved in 3 steps

Knowledge Booster


Learn more about
Need a deep-dive on the concept behind this application? Look no further. Learn more about this topic, economics and related others by exploring similar questions and additional content below.Recommended textbooks for you
Managerial Economics: Applications, Strategies an…
Economics
ISBN:
9781305506381
Author:
James R. McGuigan, R. Charles Moyer, Frederick H.deB. Harris
Publisher:
Cengage Learning
Managerial Economics: Applications, Strategies an…
Economics
ISBN:
9781305506381
Author:
James R. McGuigan, R. Charles Moyer, Frederick H.deB. Harris
Publisher:
Cengage Learning