The graph below shows population growth for paramecia kept under laboratory conditions for 18 days. 120+ S 80+ 40- 4. 6. 10 12 14 16 18 Time (days) Which one of the following statements explains what is happening in the region of the curved labeled "X"? Othe population's birthrate equals the death rate Othe paramecia have used up their food supply Othe paramecia are in water that is too warm the population's birthrate is zero Population Size
The graph below shows population growth for paramecia kept under laboratory conditions for 18 days. 120+ S 80+ 40- 4. 6. 10 12 14 16 18 Time (days) Which one of the following statements explains what is happening in the region of the curved labeled "X"? Othe population's birthrate equals the death rate Othe paramecia have used up their food supply Othe paramecia are in water that is too warm the population's birthrate is zero Population Size

Biology (MindTap Course List)
11th Edition
ISBN:9781337392938
Author:Eldra Solomon, Charles Martin, Diana W. Martin, Linda R. Berg
Publisher:Eldra Solomon, Charles Martin, Diana W. Martin, Linda R. Berg
Chapter54: Community Ecology
Section: Chapter Questions
Problem 17TYU: INTERPRET DATA Examine the top and middle graphs in Figure 54-5. Are these examples of exponential...

Related questions
Question
What is the answer ?
Transcribed Image Text:Submit Te
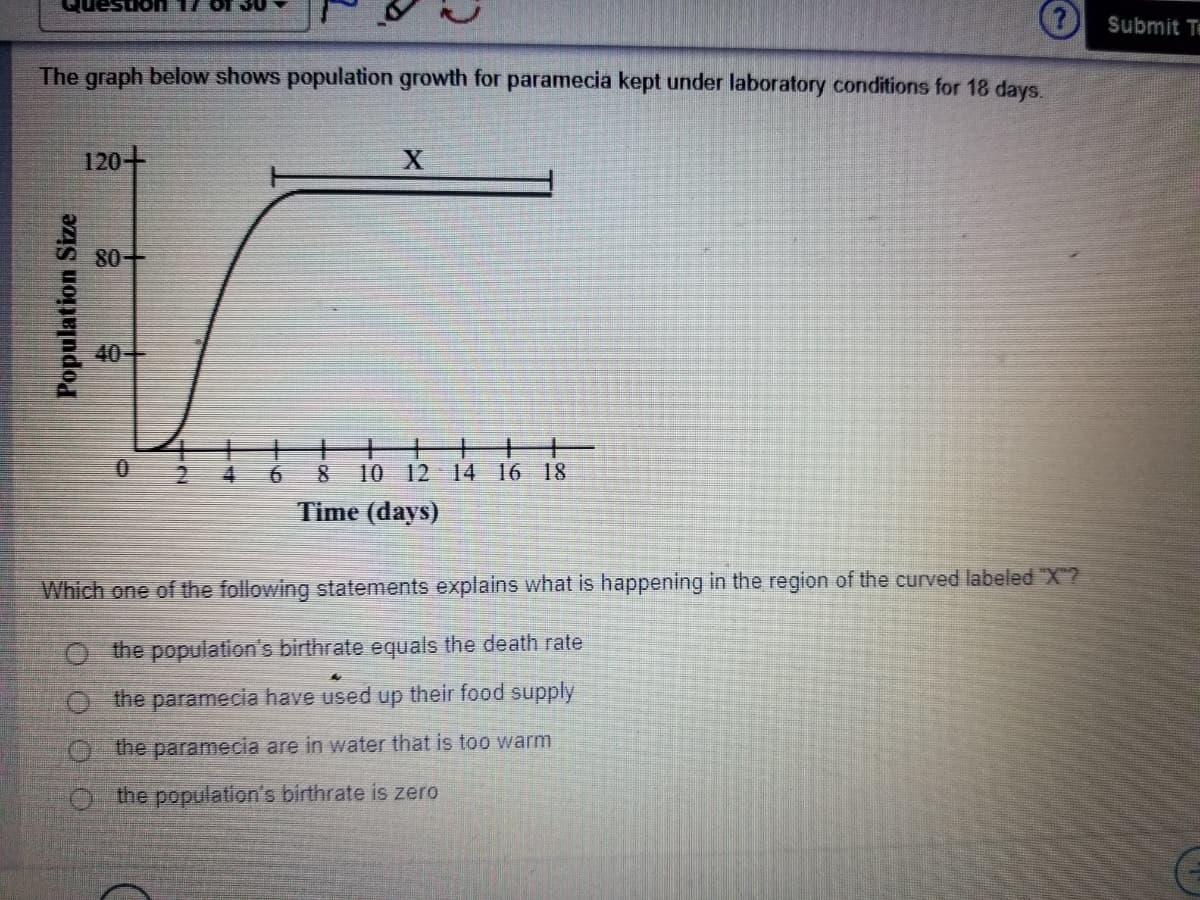
The graph below shows population growth for paramecia kept under laboratory conditions for 18 days.
120+
S80
40
4.
6.
10 12 14 16 18
Time (days)
Which one of the following statements explains what is happening in the region of the curved labeled "X?
Ot he population's birthrate equals the death rate
Othe paramecia have used up their food supply
O the paramecia are in water that is too warm
Othe population's birthrate is zero
Population Size
Transcribed Image Text:P Performance Matters
Welcome, Jasunney Goins!
Question 17 of 30-
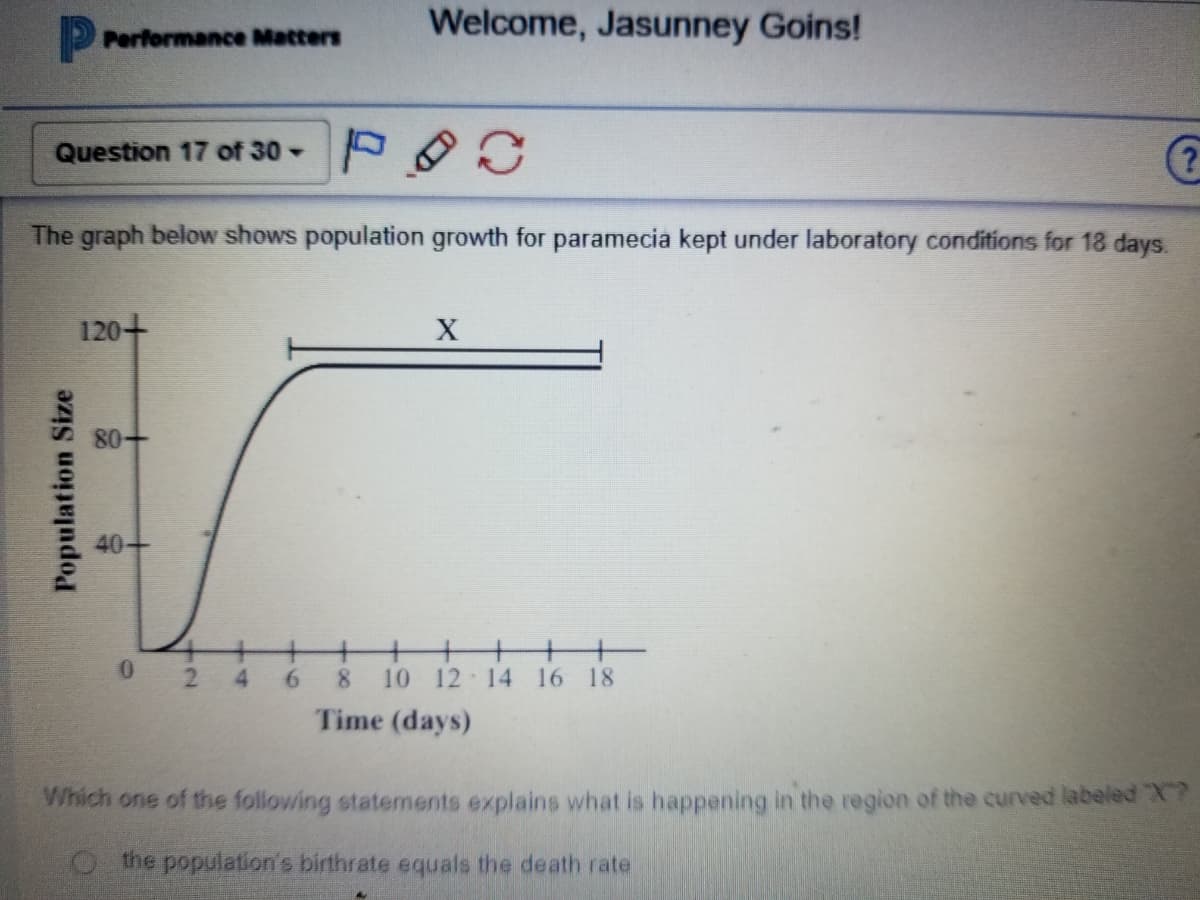
The graph below shows population growth for paramecia kept under laboratory conditions for 18 days.
120+
X
80-
40+
+
+
0 2
6.
8.
10 12 14 16 18
Time (days)
Which one of the following statements explains what is happening in the region of the curved labeled X?
Othe population's birthrate equals the death rate
Population Size
Expert Solution
This question has been solved!
Explore an expertly crafted, step-by-step solution for a thorough understanding of key concepts.

This is a popular solution!

Trending now
This is a popular solution!

Step by step
Solved in 2 steps

Knowledge Booster


Learn more about
Need a deep-dive on the concept behind this application? Look no further. Learn more about this topic, biology and related others by exploring similar questions and additional content below.Recommended textbooks for you
Biology (MindTap Course List)
Biology
ISBN:
9781337392938
Author:
Eldra Solomon, Charles Martin, Diana W. Martin, Linda R. Berg
Publisher:
Cengage Learning


Biology (MindTap Course List)
Biology
ISBN:
9781337392938
Author:
Eldra Solomon, Charles Martin, Diana W. Martin, Linda R. Berg
Publisher:
Cengage Learning