The graph illustrates the distribution of test scores taken by College Algebra students. The maximum possible score on the test was 130, while the mean score was 80 and the standard deviation was 12. 44 56 68 80 92 104
The graph illustrates the distribution of test scores taken by College Algebra students. The maximum possible score on the test was 130, while the mean score was 80 and the standard deviation was 12. 44 56 68 80 92 104

MATLAB: An Introduction with Applications
6th Edition
ISBN:9781119256830
Author:Amos Gilat
Publisher:Amos Gilat
Chapter1: Starting With Matlab
Section: Chapter Questions
Problem 1P

Related questions

Question
Transcribed Image Text:8:37
Done
A myopenmath.com
AA
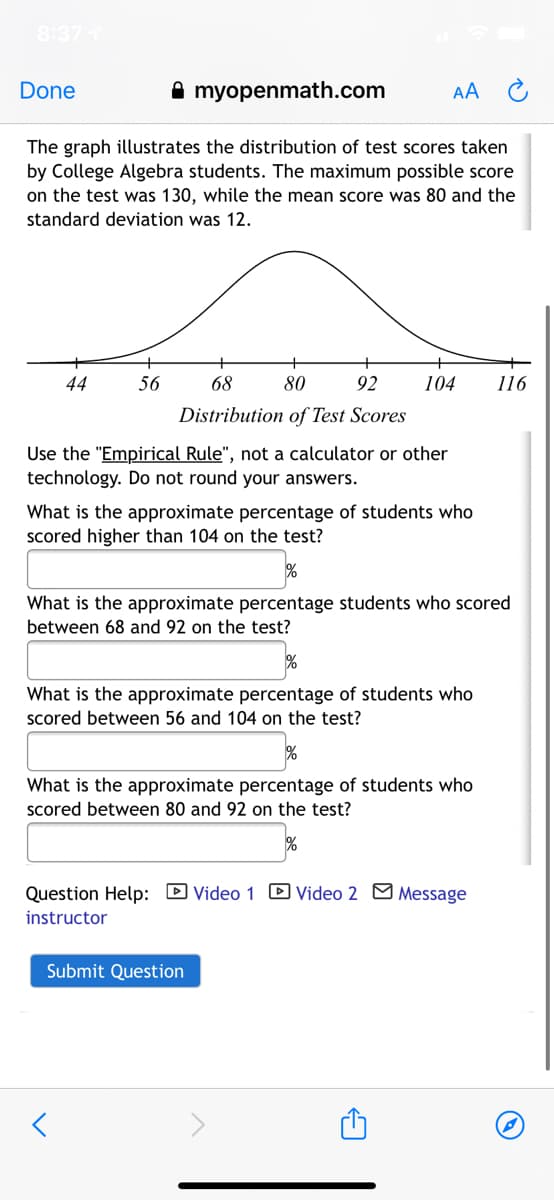
The graph illustrates the distribution of test scores taken
by College Algebra students. The maximum possible score
on the test was 130, while the mean score was 80 and the
standard deviation was 12.
44
56
68
80
92
104
116
Distribution of Test Scores
Use the "Empirical Rule", not a calculator or other
technology. Do not round your answers.
What is the approximate percentage of students who
Scored higher than 104 on the test?
What is the approximate percentage students who scored
between 68 and 92 on the test?
What is the approximate percentage of students who
scored between 56 and 104 on the test?
%
What is the approximate percentage of students who
scored between 80 and 92 on the test?
Question Help: D Video 1 D Video 2 M Message
instructor
Submit Question
Expert Solution
Step 1
Note:
As per the guidelines, we are only allowed to solve three subparts, please post the other questions as a different question.
According to the empirical rule, for normal distribution, 95% of the values lie two standard deviations from the mean. This means that of the 5% observations lie outside two standard deviations from the mean, that is of 2.5% the observations will be less than two standard deviations of the mean and 2.5% of the observations will be above than two standard deviations of the mean.
The percentage of students who scored higher than 104 lies two standard deviations from the mean. This means that the required percentage is approximately 2.5%.

Trending now
This is a popular solution!

Step by step
Solved in 3 steps

Knowledge Booster


Learn more about
Need a deep-dive on the concept behind this application? Look no further. Learn more about this topic, statistics and related others by exploring similar questions and additional content below.Recommended textbooks for you
MATLAB: An Introduction with Applications
Statistics
ISBN:
9781119256830
Author:
Amos Gilat
Publisher:
John Wiley & Sons Inc

Probability and Statistics for Engineering and th…
Statistics
ISBN:
9781305251809
Author:
Jay L. Devore
Publisher:
Cengage Learning

Statistics for The Behavioral Sciences (MindTap C…
Statistics
ISBN:
9781305504912
Author:
Frederick J Gravetter, Larry B. Wallnau
Publisher:
Cengage Learning
MATLAB: An Introduction with Applications
Statistics
ISBN:
9781119256830
Author:
Amos Gilat
Publisher:
John Wiley & Sons Inc
Probability and Statistics for Engineering and th…
Statistics
ISBN:
9781305251809
Author:
Jay L. Devore
Publisher:
Cengage Learning
Statistics for The Behavioral Sciences (MindTap C…
Statistics
ISBN:
9781305504912
Author:
Frederick J Gravetter, Larry B. Wallnau
Publisher:
Cengage Learning

Elementary Statistics: Picturing the World (7th E…
Statistics
ISBN:
9780134683416
Author:
Ron Larson, Betsy Farber
Publisher:
PEARSON

The Basic Practice of Statistics
Statistics
ISBN:
9781319042578
Author:
David S. Moore, William I. Notz, Michael A. Fligner
Publisher:
W. H. Freeman

Introduction to the Practice of Statistics
Statistics
ISBN:
9781319013387
Author:
David S. Moore, George P. McCabe, Bruce A. Craig
Publisher:
W. H. Freeman