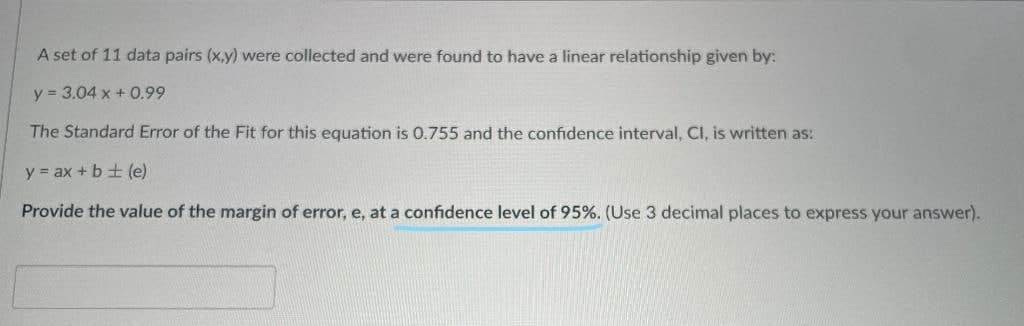
A set of 11 data pairs (x.y) were collected and were found to have a linear relationship given by: y = 3.04 x + 0.99 The Standard Error of the Fit for this equation is 0.755 and the confidence interval, CI, is written as: y = ax + b+ (e) Provide the value of the margin of error, e, at a confidence level of 95%. (Use 3 decimal places to express your answer).


Q: an accommodate 40 passengers and each seat costs 4,000 Php. Suppose each passenger books a ticket…
A: Flight Capacity 40 Each ticket cost 4000 Flight Occupancy 95% Airlines are aware of the 95%…
Q: In Orange County, 51% of the adults are males. One adult is randomly selected for a survey involving…
A:
Q: 7.3146 A study compared three display panels used by air traffic controllers. Each display panel was…
A: Please find the solution below. Thank you.
Q: Fit a parabolic equation of second degree to the following data and obtain the trend values…
A:
Q: The population of dragonflies in Cititon have lengths that are normally distributed with a mean of 7…
A:
Q: What is the relationship between the number of minutes per day a woman spends talking on the phone…
A: For the given data find the required blanks
Q: C. Compute the sample coefficient of determination and interpret. D. Using a 0.01 level of…
A: The provided information is Temperature x Conv. Sugar y xy x2 y2 1.0 8.1 8.1 1 65.61 1.1 7.8…
Q: PROBLEM 1. The researcher conducted an experiment to determine whether sleep duration has an effect…
A: The objective is to determine whether sleep duration has an effect on the level of concentration of…
Q: To find P(x<2.35) where do you shade?
A: Left side
Q: his year Carroll graduates 8 physics majors, and each of them takes a standardized national physics…
A: Solution-: Given: μ0=71,n=8, α=0.1 We find, (a) Test statistic=? (b) p-value=?
Q: ENTIFY THE SAMPLE SIZE WHEN THE LOT SIZE IS 200 UNITS, THE INSPECTION IS NORMAL LEVEL II. THE…
A: 1) the lot size (n) = 200 and THE ACCEPTANCE QUALITY LEVEL IS 1.0% The inspection is normal general…
Q: Complete the curve below by entering the values of areas under the curve, the values of 1, 2 and 3…
A: The provided information is µ=80 σ=20 n=500 a. The empirical rule is µ=80 1 68% µ-σ and µ+σ…
Q: 3. If you're given a value of a, then what do you do if the p-value < a?
A: If we are given the value of α and p-value
Q: ustration 9.14. Obtain the median size of shoes sold from the following data. TABLE 9.14. NUMBER OF…
A: Data given x Frequency (f) cf 5 30 30 5.5 40 70 6 50 120 6.5 150 270 7 300 570 7.5…
Q: Wi-Fi Access A survey of 60 students in grades 4 through 12 found 63% have classroom Wi-Fi access.…
A:
Q: Sandy owns a small business that would cost $150,000 to replace if it was ever destroyed by fire.…
A:
Q: Here is a data set (n = 117) that has been sorted. 36.8 37.9 38.7 39.4 41.9 43.9 44 45 45.5 45.6…
A:
Q: 1. The grades of a class of 9 students on a midterm report and on the final examination are as…
A: For the given data Find ( A) what is dependent and independent variable ? (B ) r =? ( C ) r -square…
Q: The Kak Ramah company supplies vegetables to shop as wholesales. The demand for the vegetables…
A: The data given is: Price per kg (RM) Demand (kg) 20 700 22 685 24 630 26 580 28 515…
Q: please interpret the models
A: Residual plots and normal probability plots are diagnostic tools for checking the simple linear…
Q: Q/ In the vehicle speed test, the results are given in the table below: Find 1. Arithmetic mean 2.…
A:
Q: Sample 1 Assume that both populations are normally distributed. a) Test whether u, >H, at the a=…
A: Solution-: Given: n1=20,n2=12,x1¯=47.5,x2¯=37.6,s1=6.9,s2=9,α=0.05 We want to (a) Test whether…
Q: Independent Samples Test t-test for Equality of Means Std. Error Difference .31258 Мean Difference I…
A:
Q: The International Air Transport Association surveys business travelers to develop quality ratings…
A: Givensample size(n)=50Mean(x)=3.34standard deviation(s)=2.163confidence interval = 95%
Q: A university department maintains an emergency computer repair shop. Histo shows that broken…
A: Given: 4 computers/day = 1 technician 8 computers/day = 2 technicians
Q: 11. There are 8 women and 10 men in the math department. (a) How many ways can a committee of 4…
A: Given that, there are 8 women and 10 men in the math department. We need to find: (a) How many ways…
Q: Let X and Y be two random variables with joint density function give. f(r, y) = 105xr*(1 –…
A: Solution
Q: 3. (Example 3) Suppose mean of x = 37.5ml/ sample size necessary mean plasma volume Fischbach).
A: Given,margin of error(E)=2.50standard deviation(σ)=7.50α=1-0.99=0.01α2=0.005Z0.005=2.58 (from…
Q: A survey asking mobile phone users how long they would wait for a page to load found the following…
A:
Q: The following table shows the frequency of outcomes when two distinguishable coins were tossed 5,600…
A:
Q: 2. During the pandemic people have become more health conscious, especially in eating red meat. In…
A: Given Sample mean x̄=48, n=sample size=100, population mean μ=51, level of significance ɑ=0.05
Q: .If a random variable X has the gamma distribution with α = 2 and β = 1, find P(1.8 < X < 2.4).
A: Since you have posted multiple questions, as per our guidelines, we have provided answer for first…
Q: D. Using a 0.05 level of significance, test the hypothesis that there is no significant linear…
A: For the given data Find
Q: For each of the following situations determine if the Central Limit Theorem can be applied: (Type Y…
A: Given that X~Normal(μ=98.6 , ?=0.6) A) n=14 B) n=10 C) n=800
Q: 13. A New York Times article reported that a survey conducted in 2014 included 36,000 adults, with…
A: Given that
Q: What patterns does the calculation tell you about within the mean, how is it useful? Does it make…
A: Mean, median, mode are measures of central tendency, and the standard deviation is the measure of…
Q: uncarne dirrerent from the mean amount of airborne bacteria in uncarpeted rooms. To test this,…
A:
Q: 5 STEP HYPOTHESIS TESTING AND PLS ANSW
A: From the given information, Choices Frequency Percentage 1 0 0% 2 2 11.80% 3 5 29.40% 4 4…
Q: (b) A manager of a recreational club would like to compare the satisfaction level between their male…
A: There are two independent samples which are male and female. We have to test whether the male…
Q: The weights of students in a certain school are normally distributed with a mean weight of 66 kg.…
A: Given that, the weights of students in a certain school are normally distributed with a mean weight…
Q: 1.Explain what the statistician is doing here? 2. Classify this test according to Left, Right or…
A: Given Test of μ=76 vs μ<76 Mean=77.25, Std Dev =13.13 n=5 Note: According to Bartleby…
Q: Which of the following is a deductive reasoning? a. The last digit of 2 raised to 6 is 6,so as 4…
A: Deductive reasoning: Deductive reasoning is the process of arriving at a conclusion based on…
Q: Visual Representation: Desirability Survey HISTOGRAM: DESIRABILITY BOX & WHISKER: SCORES…
A: Given the histogram and box plot of desirability scores of employee and manager. We have to explain…
Q: 14. A stationary shop offers four major types of stationary to customers. The prices and quantities…
A:
Q: A testing specialist has created a 4-item test of shyness and given it to a random sample of five…
A: In order to perform the consistency reliability of the test, the following steps need to be…
Q: The management of Brinkley Corporation is interested in using simulation to estimate the profit per…
A:
Q: In Exercise 3.1 you calculated summary statistics for the sample of 50 student GPAs in the file…
A: 1. Given claim: More than 50% of the students are females. Null Hypothesis: H0:p<=0.50…
Q: (a) Does the distribution of fatal injuries for riders not wearing a helmet follow the distribution…
A: The claim is that the distribution of fatal injuries for riders not wearing a helmet follow the…
Q: 1. Let A and B be two events such that P(A) = 0.4, P(B) = 0.7, P(A U B) = 0.9 a) Find P(A N B). b)…
A: Solution-: Given: P(A)=0.4, P(B)=0.7, P(A∪B)=0.9 We find, (d) P(AC-B)=?
Q: Here is a data set that has a nearly normal distribution. data data data data 47.36 36.38 41.34…
A: Frequency distribution is an way of arranging data in meaningful way.


Trending now
This is a popular solution!

Step by step
Solved in 2 steps with 2 images

- A major credit card company is interested in whether there is a linear relationship between its internal rating of a customer’s credit risk and that of an independent rating agency. The company collected a random sample of 200 customers and used the data to test the claim that there is a linear relationship. The following hypotheses were used to test the claim. H0:β1=0Ha:β1≠0 The test yielded a t-value of 3.34 with a corresponding p-value of 0.001. Which of the following is the correct interpretation of the p-value? If the alternative hypothesis is true, the probability of observing a test statistic at least as extreme as 3.34 is 0.001. If the alternative hypothesis is true, the probability of observing a test statistic at least as extreme as 3.34 is 0.001. A If the alternative hypothesis is true, the probability of observing a test statistic of 3.34 or greater is 0.001. If the alternative hypothesis is true, the probability of observing a test statistic of 3.34 or greater…The attached data contains Part Quality data of three suppliers. At = 0.05, does Part Quality depend on Supplier, or should the cheapest Supplier be chosen?The relationship between sleep hours and overall happiness level on the next day was estimated as below in a linear format. (Happiness level is measured through a five-point scale: 1 = Extremely unhappy, 5 = Extremely happy) Overall happiness level = 0.27 * Sleep hours + 2.34 (The p-value for the coefficient of Sleep hours is 0.02.) Based on this equation, what is the expected happiness level of a person on a certain day, when he slept 7 hours the day before?
- A survey of folk music fans yields this 95% confidence interval estimate of the proportion of fans who love the music of David Wilcox: 0.74 to 0.86. To the nearer percentage point, the margin of error for this survey isA confidence interval for the difference in the number of friends that men and women have was found to be -1.8 to 0.8. Find the midpoint of this confidence interval.If a 90% confidence interval for the mean is (75.3 to 80.9), we would reject H0 : = 70 in favor of H1 : not equal to 70 at 0.05 True or False?
- two 95 percent confidence intervals will be constructed to estimate the difference in means of two populations, R and J. One confidence interval, I400, will be constructed using samples of size 400 from each of R and J, and the other confidence interval, I100, will be constructed using samples of size 100 from each of R and J. When all other things remain the same, which of the following describes the relationship between the two confidence intervals?Numerous studies have found that males report higher self-esteem than females. The results show a mean self-esteem score of M = 39 with SS = 60.2 for a sample of n = 10 male adolescents and a mean of M = 35.4 with SS = 69.4 for a sample of n = 10 female adolescents. Use α = .05. a. Do the results indicate that self-esteem is significantly higher for males? b. Compute the 90% confidence intervalA dentist wanted to determine if a relationship existed between childhood fluoride exposure and cavities. She took a sample of adults in her practice and counted how many cavities each person had in his or her permanent teeth. She also determined how many years of childhood each person was exposed to tap water with fluoride. The minimum value on this variable was 0 and the maximum was 18. Using the data below, an alpha of .05 and a two-tailed test, was there a significant relationship? Years of fluoride Number of cavities 0 10 18 1 2 7 12 3 3 4 10 5 M = 7.5s =6.98 M = 5.00s = 3.16
- I would need some help with finding the best predicted value of y corresponding to the given value of x.Use a t table to find the value of t to use in a confidence interval?Two 95 percent confidence intervals will be constructed to estimate the difference in means of two populations, R and J. One confidence interval, I400, will be constructed using samples of size 400 from each of R and J, and the other confidence interval, I100, will be constructed using samples of size 100 from each of R and J. When all other things remain the same, which of the following describes the relationship between the two confidence intervals? a)The width of i400 will be 4 times the width of i100. b) The width of i400 will be 2 times the width of i100 c)The width of i400 will be equal to the width of i100. d)The width of I400 will be 1/2 times the width of I100 e)The width of I400 will be 1/4 times the width of I100.