The graph of a probability distribution is shown below. The graph is made up of a line segment and two curved paths. 0.175- 6. 9 10 11 12 too
The graph of a probability distribution is shown below. The graph is made up of a line segment and two curved paths. 0.175- 6. 9 10 11 12 too

Chapter8: Sequences, Series,and Probability
Section8.7: Probability
Problem 35E: Unemployment In 2015, there were approximately 8.3 million unemployed workers in the United States....

Related questions
Question
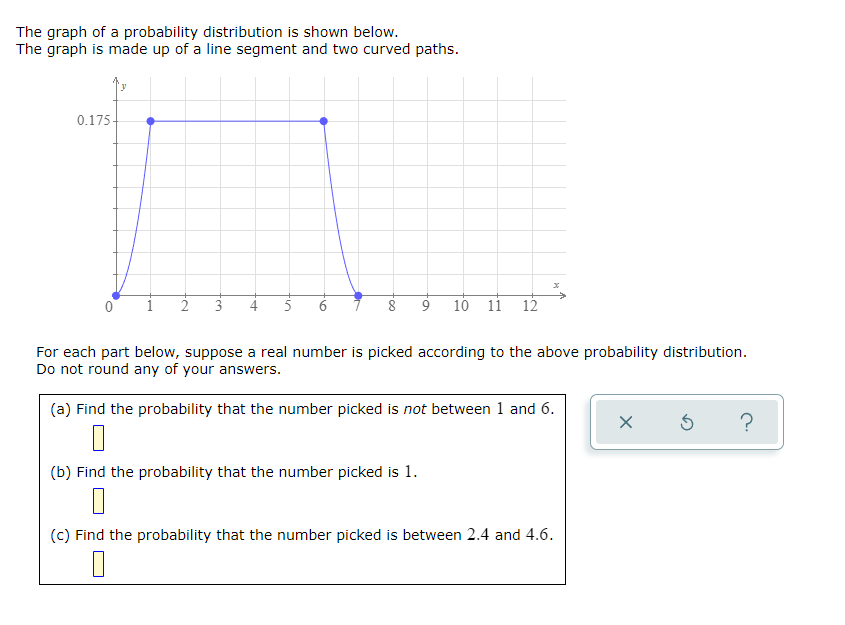
Transcribed Image Text:The graph of a probability distribution is shown below.
The graph is made up of a line segment and two curved paths.
0.175-
3
10 11 12
For each part below, suppose a real number is picked according to the above probability distribution.
Do not round any of your answers.
(a) Find the probability that the number picked is not between 1 and 6.
(b) Find the probability that the number picked is 1.
(c) Find the probability that the number picked is between 2.4 and 4.6.
Expert Solution
This question has been solved!
Explore an expertly crafted, step-by-step solution for a thorough understanding of key concepts.

This is a popular solution!

Trending now
This is a popular solution!

Step by step
Solved in 3 steps with 6 images

Recommended textbooks for you

College Algebra (MindTap Course List)
Algebra
ISBN:
9781305652231
Author:
R. David Gustafson, Jeff Hughes
Publisher:
Cengage Learning
College Algebra (MindTap Course List)
Algebra
ISBN:
9781305652231
Author:
R. David Gustafson, Jeff Hughes
Publisher:
Cengage Learning