The graph of the annual snowfall distribution (in feet) for a particular county is shown below on the left with its mean and standard deviation. Assume that a sample size of 225 is drawn from the population. Determine which of the graphs labeled (a)-(c) would most closely resemble the sampling distribution of the sample means. Explain your reasoning. 0.16 P(x) 2.1 Snowfall (in feet) Choose the correct graph below. OA. Q OB. OC. P(2) =0.14 P(i) =0.233 =0.140 =21 H =3.5 H=3.5 10 13 Snowfall (in feet) Snowfall (in feet) Snowfall (in feet) This graph most closely resembles the sampling distrībution of the sample means, because p: =.0: =. and the graph is the same shape as the graph for the original distribution. approximates a normal curve.
The graph of the annual snowfall distribution (in feet) for a particular county is shown below on the left with its mean and standard deviation. Assume that a sample size of 225 is drawn from the population. Determine which of the graphs labeled (a)-(c) would most closely resemble the sampling distribution of the sample means. Explain your reasoning. 0.16 P(x) 2.1 Snowfall (in feet) Choose the correct graph below. OA. Q OB. OC. P(2) =0.14 P(i) =0.233 =0.140 =21 H =3.5 H=3.5 10 13 Snowfall (in feet) Snowfall (in feet) Snowfall (in feet) This graph most closely resembles the sampling distrībution of the sample means, because p: =.0: =. and the graph is the same shape as the graph for the original distribution. approximates a normal curve.

Glencoe Algebra 1, Student Edition, 9780079039897, 0079039898, 2018
18th Edition
ISBN:9780079039897
Author:Carter
Publisher:Carter
Chapter10: Statistics
Section10.4: Distributions Of Data
Problem 22PFA

Related questions
Question
Please answer the questions in the photo. Thank You!
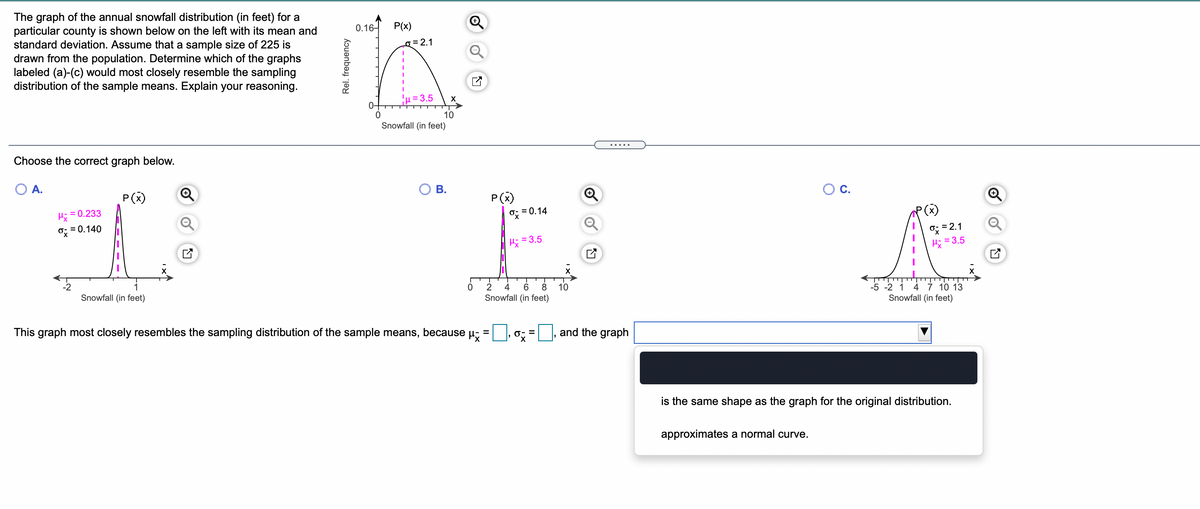
Transcribed Image Text:The graph of the annual snowfall distribution (in feet) for a
particular county is shown below on the left with its mean and
standard deviation. Assume that a sample size of 225 is
drawn from the population. Determine which of the graphs
labeled (a)-(c) would most closely resemble the sampling
distribution of the sample means. Explain your reasoning.
0.16-
P(x)
g = 2.1
=3.5
10
Snowfall (in feet)
.....
Choose the correct graph below.
O A.
OC.
P(x)
P(x)
= 0.233
o; = 0.14
O=2.1
Hi = 3.5
o; = 0.140
= 3.5
4 7 10 13
Snowfall (in feet)
-2
1
2
6
8
10
-5 -2 1
Snowfall (in feet)
Snowfall (in feet)
This graph most closely resembles the sampling distribution of the sample means,
because
and the graph
%D
%3D
is the same shape as the graph for the original distribution.
approximates a normal curve.
Rel. frequency
B.
Expert Solution
This question has been solved!
Explore an expertly crafted, step-by-step solution for a thorough understanding of key concepts.

This is a popular solution!

Trending now
This is a popular solution!

Step by step
Solved in 2 steps with 5 images

Recommended textbooks for you
Glencoe Algebra 1, Student Edition, 9780079039897…
Algebra
ISBN:
9780079039897
Author:
Carter
Publisher:
McGraw Hill
Glencoe Algebra 1, Student Edition, 9780079039897…
Algebra
ISBN:
9780079039897
Author:
Carter
Publisher:
McGraw Hill