The graph shows cost and revenue curves for producing different amounts of chairs. Suppose the marker for chairs in this example is a monopoly. On the graph, suppose that: A = $39, B = $17, C= $9, D - 10 and E= 38. FA Price MC Quantity
The graph shows cost and revenue curves for producing different amounts of chairs. Suppose the marker for chairs in this example is a monopoly. On the graph, suppose that: A = $39, B = $17, C= $9, D - 10 and E= 38. FA Price MC Quantity

Economics (MindTap Course List)
13th Edition
ISBN:9781337617383
Author:Roger A. Arnold
Publisher:Roger A. Arnold
Chapter23: Monopoly
Section: Chapter Questions
Problem 2WNG

Related questions
Question
7
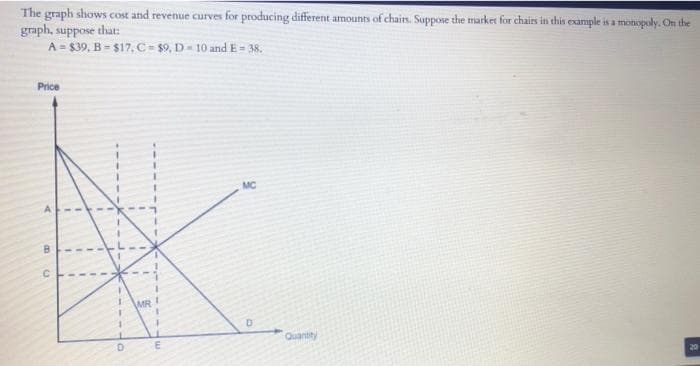
Transcribed Image Text:The graph shows cost and revenue curves for producing different amounts of chairs, Suppose the marker for chairs in this example is a monopoly. On the
graph, suppose that:
A = $39, B = $17, C= $9, D- 10 and E = 38.
Price
MC
MR!
Quantity
20
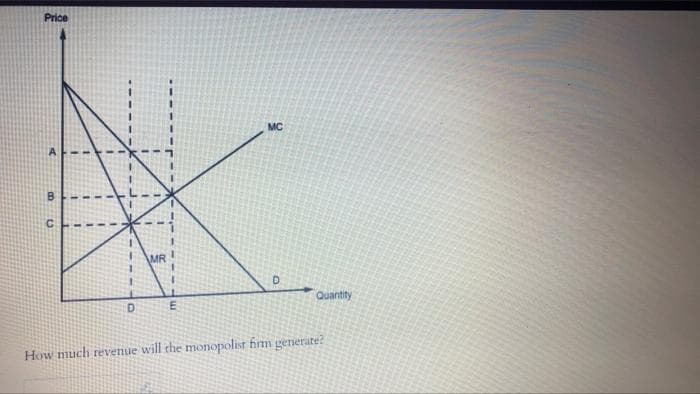
Transcribed Image Text:Price
MC
MR
Quantity
D.
How much revenue will the monopolist firm generate?
Expert Solution
This question has been solved!
Explore an expertly crafted, step-by-step solution for a thorough understanding of key concepts.

Step by step
Solved in 2 steps

Knowledge Booster


Learn more about
Need a deep-dive on the concept behind this application? Look no further. Learn more about this topic, economics and related others by exploring similar questions and additional content below.Recommended textbooks for you
Economics (MindTap Course List)
Economics
ISBN:
9781337617383
Author:
Roger A. Arnold
Publisher:
Cengage Learning


Principles of Economics 2e
Economics
ISBN:
9781947172364
Author:
Steven A. Greenlaw; David Shapiro
Publisher:
OpenStax
Economics (MindTap Course List)
Economics
ISBN:
9781337617383
Author:
Roger A. Arnold
Publisher:
Cengage Learning
Principles of Economics 2e
Economics
ISBN:
9781947172364
Author:
Steven A. Greenlaw; David Shapiro
Publisher:
OpenStax


