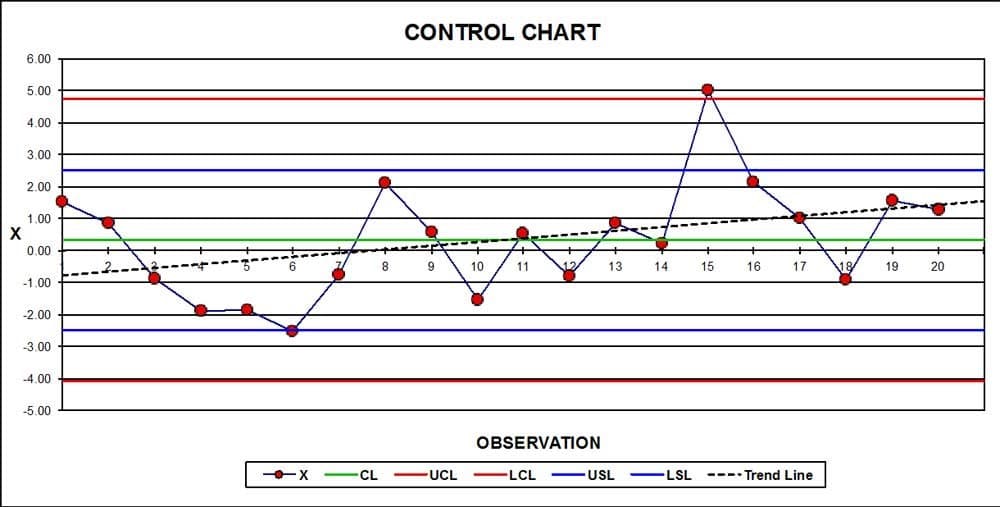
Read the story in the graph below. What concerns might you have? What actions (if any) should be taken?


Q: What is the range of the given graph below? * O [-4,0] O (-4,0) O (-2,21 O (-4,0] O 12,21 O [-2,2) O…
A: Recall: The Range of the function is the set of all values that function takes .
Q: 4 The graph shows favorite types of music chosen by some seventh graders. Favorite Types of Music…
A: The given chart represents a bar graph depicting types of music chosen by some seventh graders.
Q: An ice-cream store manager is considering adding a new flavor. The bar graph shows the best-selling…
A: Given graph of best selling ice cream flavours. We need to find the flavour wich can be added…
Q: Based on the line graph shown, how did Google's stock price perform between September 2015 and…
A:
Q: The graph below shows the cost of a taxi based on how many miles you drove in the taxi. 1. If the…
A:
Q: The graph to the right uses cylinders to represent barrels of oil consumed by two countries. Does…
A: The graph uses cylinder to represent barrels of oil consumption. The provided cylindrical shape…
Q: What will be the behavior of graph if the value of an > 0 and the dregree is an odd number? a.…
A: This question is related to graph of function solve in step 2.
Q: 3. Write an equation that can be used to model the graph shown below: -20 /2 21/3. TI/3 ST/6 10-…
A:
Q: The graph and the answers choice
A: Given information: There are two triangles ABC and DEFand both the triangles are congruent by SAS…
Q: ortional relationship between the amount of money in Jack's sa ng money. Jack's Savings Account 35…
A: Consider the given graph. Along the x-axis, number of weeks is taken and along the y-axis, amount in…
Q: E Which graph has the largest value for b? O A
A:
Q: Questions: (b) What percentage of employees make less than $10,000 per month? (c) Write a…
A: Questions: (b) What percentage of employees make less than $10,000 per month?(c) Write a sentence…
Q: dlo Air Pollution The Environmental Protection Agency must investigate 10 mills for complaints of…
A: We have to find no. Of ways...
Q: If you drew a graph of this map what would be the degree of ACT? See attached.
A: First we find the graph of the map
Q: Section 2: Multiple Choice 1. Which of the following is the best statement about the graph? a) After…
A: Givenby graph we can see that
Q: -20어 10 (18, 2) -10 10 20 30 -10-
A:
Q: 20 5 10 15 20 25 30 35 40 45 50 55 Based on the graph, about how many students will hear the rumor?…
A: We have to find total number of students that hear rumors
Q: The illustration below depicts bridges connecting islands in a river to the banks. Can a person…
A:
Q: Which among the graphs is more convenient to use? BAR GRAPH or PIE GRAPH?
A: Pie graph become confusing when there are many distributions. Also, it becomes very difficult to…
Q: Consider the description of the attendance throughout the evening of a high school prom. The prom…
A: Attendance will be constant once the entry is closed.
Q: Which graph represents y=-3
A:
Q: Which equation is represented by the graph drawn in the accompanying diagram? • (3,2) 2- 4.
A: Given: To find: Equation of the circle from the given options
Q: The table shows how many orders were placed for each type of muffin at a bakery in one week. Туре…
A:
Q: The graph shows the number of deaths in the United States due to accidents. Answer the following…
A: Given graph shows the number of deaths in the US due to accidents.
Q: Using the graph below, answer the following questions. O Chicago High o Chicago Low 90 84 82 80 75…
A:
Q: easons We Travel The following data are based on a survey from a travel survey on why people travel.…
A: I have provided all the details of pie chart
Q: 16. What is an appropriate title for the graph showing the distance a dog is walked in a week? feet…
A:
Q: Look at the diagram. S.
A: The given figure is:
Q: AVA
A:
Q: In a local shelter, 150 people donated blood during the blood donation week. The samples collected…
A: It is given that, There is 150 people in shelters. From the pie chart, we can see that No. od…
Q: Four people play a board game together several times. The graph shows the number of times each…
A: A detailed solution is given below.
Q: The graph to the right compares teaching salaries of women and men at private colleges and…
A: Introduction: The teaching salaries of men and women in private colleges and universities are…
Q: Joes company rents cars to people who are at least 21 years of age. Which graph represents the…
A: Given that people whose age is 21 years or greater than 21 years can rent car from the given…
Q: Graph ?(?)=?3+3?2−9?−27
A: Cubic graph
Q: Are the graphs below equal? G1 = ({a,b,c},{{a,b},{b,c}}) ; G2= ({a,b,c},{{a,c},{c,b}})
A: Two graphs are equal if they have set of vertices as well as same set of edges.
Q: What is the domain of the graph above? O A) [-2, 0) Ов [-5, — 2)U (-1, o) C) [-2, 3] O D) [-5, – 2)…
A: Solution
Q: The door plan of a warehouse is illustrated below. Use a graph to represent the door plan, and…
A: Vertex is where two or more edges meet. The degree of a vertex is the number of edges originating…
Q: Use the graph to answer the question
A: Given graph is We have to find ∫0L+F+LF f(x) dx
Q: Referring to the graph above, which of the following statements is correct:
A:
Q: In a recent article you see a histogram graph that displayed the average number of hours teens get…
A: We have to find type of statistics.
Q: 5.1 5) Look at the school lunch graph created by some students: a) In what way is this graphical…
A: Given information: Variable of interest=Favourite school lunchNo. of lunch=02Lunch=1.Pizza.2.Chicken…
Q: The book The Wall Street Journal. Guide to Information Graphics by Dona M. Wong gives strategies for…
A: (a) From the given to donut pie charts, the sizes for the three categories are different.Hence, the…
Q: Air Pollution The Environmental Protection Agency must investigate 10 mills for complaints of air…
A: Combination : The combination is used to select subject in which order does not matters. The number…
Q: Consider the description of the attendance throughout the evening of a high school prom. • The prom…
A: As per given information, prom committee has started setting up for the dance, that means the graph…
Q: (A)
A: Both of the graphs have shaded area which can be p-values. a.) When H0: μ=μ0 vs H1: μ<μ0, the…
Q: Use the graph below to answer the questions that follow: Scores on a basie Math Test 40 50 60 70 80…
A: We have to find answer by using this graph...
Q: Scientists studied pocket mice living on dark volcanic rock in both new mexico and fifty miles away…
A: One possible hypothesis that would explain the differences in the observed data between the two…
Q: 15. Which of these diagrams could represent the top view of a standard drinking cup? B Provide an…
A: option B is correct.
Q: Use the graph below to answer the questions that follow: a. What type of graph is this? Answer: b.…
A: To find the given questions based on graph.
Q: whats the answer of part 2 ( the graph)
A: Let's find graph of given function.
Read the story in the graph below. What concerns might you have? What actions (if any) should be taken?


Trending now
This is a popular solution!

Step by step
Solved in 2 steps with 2 images

- Hablon Packaging Solution, Inc. is a food packaging manufacturing industry that produced sustainable packaging safe for food use. You are a Quality Control Manager that is due to report the status of the production of bioengineered banana-leaf based 3 side seal packs for a customer that produces Ibus. You want to present the number of defects that occurred in the month of April 2022. Celeste Cortesi, your Quality Control Inspector, summarized the data for the month of April for you (see below). Using the data, create a: Scatter diagram Then, write an overall interpretation based on your charts. Production Date Sampling occurrences (20 sampling per day) Leaking Delamination Discoloration Puncture Wrinkles Tunneling 04/04/22 5 1 0 6 1 1 04/05/22 8 4 0 3 0 1 04/06/22 10 3 1 7 0 0 04/07/22 3 1 2 4 0 2 04/08/22 5 0 0 2 3 0 04/11/22 4 2 0 6 0 0 04/12/22 9 2 0 6…Hablon Packaging Solution, Inc. is a food packaging manufacturing industry that produced sustainable packaging safe for food use. You are a Quality Control Manager that is due to report the status of the production of bioengineered banana-leaf based 3 side seal packs for a customer that produces Ibus. You want to present the number of defects that occurred in the month of April 2022. Celeste Cortesi, your Quality Control Inspector, summarized the data for the month of April for you (see below). Using the data, create a: Histogram Then, write an overall interpretation based on your charts. Production Date Sampling occurrences (20 sampling per day) Leaking Delamination Discoloration Puncture Wrinkles Tunneling 04/04/22 5 1 0 6 1 1 04/05/22 8 4 0 3 0 1 04/06/22 10 3 1 7 0 0 04/07/22 3 1 2 4 0 2 04/08/22 5 0 0 2 3 0 04/11/22 4 2 0 6 0 0 04/12/22 9 2 0 6 1 1…Hablon Packaging Solution, Inc. is a food packaging manufacturing industry that produced sustainable packaging safe for food use. You are a Quality Control Manager that is due to report the status of the production of bioengineered banana-leaf based 3 side seal packs for a customer that produces Ibus. You want to present the number of defects that occurred in the month of April 2022. Celeste Cortesi, your Quality Control Inspector, summarized the data for the month of April for you (see below). Using the data, create a: a. Pareto Chart Then, write an overall interpretation based on your charts. Production Date Sampling occurrences (20 sampling per day) Leaking Delamination Discoloration Puncture Wrinkles Tunneling 04/04/22 5 1 0 6 1 1 04/05/22 8 4 0 3 0 1 04/06/22 10 3 1 7 0 0 04/07/22 3 1 2 4 0 2 04/08/22 5 0 0 2 3 0 04/11/22 4 2 0 6 0 0 04/12/22 9 2 0…
- An auto-parts store offers a fuel additive that claims to increase a vehicle’s gas mileage. The additive is poured into a vehicle’s gasoline tank after the tank is filled. To measure the claim, two methods to collect data are proposed.What is the purpose of determining a measure of central tendancy?Define degrees of freedom in the context of ANOVA
