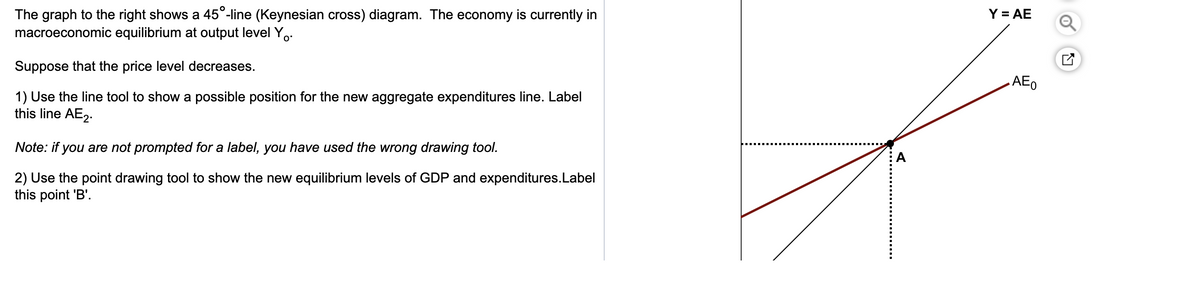
The graph to the right shows a 45°-line (Keynesian cross) diagram. The economy is currently in macroeconomic equilibrium at output level Y.. Suppose that the price level decreases. 1) Use the line tool to show a possible position for the new aggregate expenditures line. Label this line AE₂. Note: if you are not prompted for a label, you have used the wrong drawing tool. 2) Use the point drawing tool to show the new equilibrium levels of GDP and expenditures.Label this point 'B'. A Y = AE AEO
Q: What best characterizes the relationship between wage labor and capital? a) Capital produces wage…
A: In capitalist economies, wage exertions refers to the association where individuals sell their labor…
Q: 5. Problems and Applications Q5 Edison owns a water pump. Because pumping large amounts of water is…
A: A supply schedule is a table showing the quantity supplied of a commodity at each price for a given…
Q: What is the relationship between national saving and investment in a closed economy? Start by…
A: In economics, a closed economy refers to a theoretical model wherein there may be no global trade or…
Q: Explain difference between Returns to Scale Returns to Factor.
A: The difference between returns to scale and returns to factors is as follows:-
Q: A single bank is considering two options: First, it can make a $200,000 mortgage loan for a customer…
A: Given Number of loans Probability of default 25 0.03 25 0.12 25 0.015 25 0.05
Q: How does the typical state budget process work, and what are the various actors involved in that…
A: There are 5 questions and since we are not allowed to solve more than 3, the first 3 questions are…
Q: This table provides some information about hourly output and revenue for a firm in a competitive…
A: Marginal revenue measures the change in total revenue due to a change in quantity. Formula: MR =…
Q: With the aid of diagrams, explain what it means for a firm to be a price taker.
A: Perfect competition: A firm in the competitive market is a price taker because it has large number…
Q: 5. Problems and Applications Q5 Edison owns a water pump. Because pumping large amounts of water is…
A: A supply schedule is a table showing the quantity supplied of a commodity at each price for a given…
Q: The following graph represents the money market in a hypothetical economy. As in the United States,…
A: Fed is the central bank of United States which controls the supply of money in the economy.
Q: Graph shows the cost and revenue information for Shitotsu the monopolist. What are the levels of…
A: A market structure characterized by the dominance of a single seller or producer in a particular…
Q: For each of the following scenarios, begin by assuming that all demand factors are set to their…
A: If the item is a normal good, income has a positive relationship with the quantity desired. This…
Q: 4. Short-run and long-run effects of a shift in demand Suppose that the shrimp industry is in…
A: There are various factors that affect the demand and/or supply of a particular good and/or service.
Q: Consider a firm that operates in the perfectly competitive salmon farming industry. The short-run…
A: In perfect competition, There exists a large number of buyers and sellers. The firm will produce…
Q: how about questions d and e?
A: Fixed cost refers to the expenses that remain constant regardless of the level of production,…
Q: The government decides to pursue a policy of keeping the amount of tax revenue it collects to be a…
A: It implies that the government sets a target for the overall tax revenue it seeks to collect,…
Q: 9. Problems and Applications Q9 Purchasing-power parity holds between the nations of Ectenia and…
A: An exchange rate is the value of one currency in relation to another currency. It is the rate at…
Q: Suppose that the shrimp industry is in long-run equilibrium at a price of $5 per pound of shrimp and…
A: There are various factors that affect the demand and/or supply of a particular good and/or service.…
Q: What argument, based on macroeconomic theory, might a government use to justify shutting down a…
A: An economy experiences various business cycles and to stabilize the same government uses its fiscal…
Q: Which is NOT a function of the Federal Reserve? O regulating the U.S. money supply O providing loans…
A: A financial institution that is responsible for overseeing a country's monetary system and…
Q: Create a brief report on globalization in the textile industries You are looking for the main…
A: Globalization has had a significant impact on the textile industry, shaping its global integration…
Q: e) If there are two firms Atlas and Bowden in this market with the same earlier total cost function…
A: Cournot competition is an economic model that describes how companies in industry independently and…
Q: How will the following event affect variables 1 through 3 in the foreign exchange market under a…
A: A decentralized global marketplace where participants buy, sell, and exchange different currencies…
Q: Boris and Angela are negotiating a new trade deal, which resembles a modified centipede game. When…
A: There are two Players : Boris & Angela Two Nature states : L & S L : Long game , S :…
Q: a) Chika has calculated the marginal utility that she derives from her paid employment and from…
A: Chika will assign each extra hour to the activity that provides a greater marginal utility. Marginal…
Q: Note: Line segments will automatically connect the points. PRICE LEVEL (Billions of dollars) 200 160…
A: The equilibrium level in macro economy is achieved at the level where AD=SRAS=LRAS. This is called…
Q: The following questions requires two answers. Be sure to complete them all! Refer to the diagram to…
A: International trade involves the exchange of goods, services, and capital across national…
Q: A sustainable organization is an efficient organization. This means that workflows are automated…
A: Efficiency: The ability to achieve maximum productivity with minimum wasted effort or resources.…
Q: When you look at Gross Domestic Production (GDP) values of countries around the world, you notice…
A: In a country various commodities are produced during a given period of time. When the aggregate…
Q: What is the labor force participation rate?
A: Labor force participation rate can be understood as the working population section in the age…
Q: How does the graph look for the effect of a temporary but persistent increase in total factor…
A: The TFP describes how effectively inputs and outputs are integrated into an economy. It stands for…
Q: Intermediate macroeconomics: Using examples and clearly labeled graphs where applicable answer the…
A: Given the nature of global trade, states can have a presence in markets outside their own borders.…
Q: Asim's HookNLadder is the only company selling fire engines in the fictional country of Alexandrina.…
A: Marginal revenue refers to the additional revenue generated from selling one additional unit of a…
Q: Price level (GDP deflator, 2005 100) 130 120 110 0 LAS SAS AD 12.0 12.5 13.0 13.5 14.0 14.5 Real GDP…
A: AS-AD model: In this model we are given the aggregate demand curve which exhibits negative…
Q: Price of ski permits($) 20 18 16 14 12 10 8 6 4 2 0 Sprivate D private 10 20 30 40 50 60 70 80 90…
A: The social optimal level in economics refers to the point at which resources are allocated in a…
Q: Go to International Trade Centre (ITC) and use their tool of Investment Map to check Japan's total…
A: Investment refers to the act of allocating resources, such as money, time, or effort, with the…
Q: Real GDP per person is equal to: a. average labour productivity multiplied by the share of the…
A: Gross domestic product (GDP) is GDP given in basically the regular costs and refers back to the…
Q: Use the graph above to answer the following questions: Show your work. 5. What is consumer surplus…
A: Consumer surplus measures the benefit that consumers receive from purchasing a good at a price lower…
Q: For each of the following scenarios, begin by assuming that all demand factors are set to their…
A: Demand refers to the quantity of a particular good or service that consumers are willing and able to…
Q: Exhibit 19-3 Keynesian aggregate expenditures model 16 14 Real aggregate 12 expenditures 10 8 6…
A: Aggregate expenditure is the sum of: Consumption + investment + government purchases + net exports.…
Q: Provide a graphical analysis of the effect of a temporary but persistent increase in total factor…
A: The RBC model is an economic structure for studying economic variations in closed economies that are…
Q: The ethanol industry is perfectly competitive, and each producer has the long-run marginal cost…
A: In perfect competition, There exists a large number of buyers and sellers. The firm will produce…
Q: 5. Problems and Applications Q5 Edison owns a water pump. Because pumping large amounts of water is…
A: Using the given information’s, we can construct the table for supply schedule as follows. Price…
Q: 18 YEAR ANNUITY WITH 7.86% COMPOUNDED HOW MUCH TO PAY TO RECEIVE $1900 ANNUALY OVER 18 YEAR PERIOD
A: Compounding refers to a process in which the interest rate is charged on the investment as well as…
Q: suppose a technology was developed that lowered the marginal cost of fishing. What would you expect…
A: Modernization always led to a reduction in the cost of production. Modernization refers to…
Q: à central bank called the Fed, but a major difference is that this economy is closed (and therefore…
A: Aggregate demand is composed of consumption spending, investment, government purchases and net…
Q: Suppose we instead tax the consumer rather than the driver. What happens in new equilibrium compared…
A: Shifting of tax refers to the transfer of the economic burden or incidence of a tax from the entity…
Q: 108. An initial transportation solution appears in the table. C D Factory Capacity 10 0 10 15 25 40…
A: Given:- Cost from A to C=$5Cost from A to D=$7Cost from B to C=$8Cost from B to D=$9 To know:-…
Q: The convergence hypothesis states that: a. technology levels between countries eventually converge…
A: The convergence hypothesis is a major concept of development theory. It explains how the two…
Q: A monopolist faces market demand of P = 100 - Q. Its MR = 100-2Q, MC = 2Q, and ATC=Q. Determine the…
A: In a monopoly market structure, There exists a single seller. The monopolist will produce where the…
CS 19
Subject _. Economics
Trending now
This is a popular solution!
Step by step
Solved in 3 steps with 1 images
- in a closed economy with no government, where aggregate demand is determinedby autonomous consumption, investment (which is independent of output), and themarginal propensity to consume.a) Given that autonomous consumption is 20, investment is also 20, and the marginalpropensity to consume is 0.6, write out an equation for aggregate demand (AD) in thiseconomy. b) Given this aggregate demand equation, and the equilibrium equation Y = AD, usealgebra to find the equilibrium level of Y. c) Draw a diagram with output (Y) on the x-axis and aggregate demand (AD) on the yaxis. Draw two lines on this diagram: (i) Y = AD, and (ii) the aggregate demandfunction from part (a). Label the intercept of the AD line, and the point where the twolines intersect, with numerical values. (3 marks)d) Suppose that the marginal propensity to consume falls from 0.6 to 0.5. What wouldthe new equilibrium level of Y be? Illustrate your answer in the diagram you drew forpart (c). (2 marks)e) Calculate the value of…Derive the consumption function and use this relation in the aggregate demand function to derivean equation for the equilibrium in the goods market . Why the AD line is upward sloping?Suppose the government spending falls by 100 and in this case marginal propensity to consumeis 0.8. what is the value of change in output. Draw a diagram to show the shift in AD line due tothis change in government spending and output.Suppose that the federal government decides to reduce the budget deficit and cuts government purchases by $200 billion and raise personal income taxes by $200 billion. Suppose the MPC = .5. a. How much and in which direction would the AD curve shift because of the government spending cut? b. How much and in which direction would the AD curve shift because of the tax increase? Show your work. c. Using the above numbers, draw the AS-AD diagram and illustrate the short-run impact of the combined policy action assuming the economy begins at potential output. Label the original equilibrium with point "A" and the new short-run equilibrium with point "B". d. Describe the impact of the policy action on employment/unemployment, spending, and prices/inflation. Be sure to include the impact of the spending multiplier. e. In moving from points "A" to point "B" on the AS-AD diagram, why do firms change their production? f. Characterize the labor market at point "B". g. Describe the process of…
- Refer to the following figure 1. For this economy, if the actual price level exceeds theexpected price level, how much output will the economyproduce in the short-run? A)$17 trillionB)$17.2 trillionC)$16.7 trillionD) Both A and C.2. Given the situation in part (a), this economy wouldexperience A) a recessionary gap of $0.3 trillionB) an expansionary gap of $0.2 trillionC) neither a recessionary gap nor an expansionary gap.D) an expansionary gap of $17.2 trillion. 3. Given the situation in part (a), in this economy (circlethe letter representing the right answer below)A) the actual rate of unemployment would be less than thenatural rate of unemployment.B) the actual rate of unemployment would be above the naturalrate of unemployment.C) the actual rate of unemployment would be equal to thenatural rate of unemployment.D)none of the above.4. In this economy, given the situation in part (a), in thelong-run (circle the letter representing the right answerbelow)A) the nominal wage…Use the information in the following table to answer the questions below. Assume you are dealing with short-run aspects of the economy, so the marginal propensity to consume is constant. Also, for simplicity, assume this economy has no taxes. In your answers, expain brifly how did you get the numerical result. Real GDP Consumption PlannedInvestment GovernmentPurchases Net Exports $9,000 $7,800 $1,500 $1,000 -$700 $10,000 $8,600 $1,500 $1,000 -$700 $11,000 $9,400 $1,500 $1,000 -$700 $12,000 $10,200 $1,500 $1,000 -$700 $13,000 $11,000 $1,500 $1,000 -$700 $14,000 $11,800 $1,500 $1,000 -$700 Suppose net export increases by $400 (Assuming MPC, Gevernment Purchases, and Planned Investment are the same). What will be the new equilibrium level of GDP? Consumption?Use the information in the following table to answer the questions below. Assume you are dealing with short-run aspects of the economy, so the marginal propensity to consume is constant. Also, for simplicity, assume this economy has no taxes. In your answers, expain brifly how did you get the numerical result. Real GDP Consumption PlannedInvestment GovernmentPurchases Net Exports $9,000 $7,800 $1,500 $1,000 -$700 $10,000 $8,600 $1,500 $1,000 -$700 $11,000 $9,400 $1,500 $1,000 -$700 $12,000 $10,200 $1,500 $1,000 -$700 $13,000 $11,000 $1,500 $1,000 -$700 $14,000 $11,800 $1,500 $1,000 -$700 (a) What is the equilibrium level of real GDP in this economy? (b) Compute the marginal propensity to consume. (c) Compute the government expenditures multipler. (d) Suppose net export increases by $400 (Assuming MPC, Gevernment Purchases, and Planned Investment are the same). What will be the new equilibrium level of GDP? Consumption?
- Assume that the marginal propensity to consume is 0.75 and that taxes are exogenous. Imagine that government expenditure increases by $10m. Begin by assuming that the interest rate and prices stay fixed. 1. What is the value of the aggregate expenditure multiplier (k)? 2. How would the change be represented in an AD-AS diagram? 3. How would the change differ if the interest rate could change (assuming prices remain fixed)? 4. How would the change differ if the price level could also change?Considering the growing potential threat of terrorists’ attacks worldwide, the President of an economyapproved a fiscal spending of $24 billion to upgrade its national defense. a. Starting in a long-run equilibrium, draw a well-labelled AD-SRAS-LRAS diagram for the economy. b. Use the same diagram in part (a) to show the SR effect on the economy’s GDP (Y), the price level, andunemployment when the federal government increases its spending on national defense. c. To stabilize the price level and the economy’s GDP, what kind of monetary policy should the economyadopt? Illustrate your answer in the same diagram in (a).Consider a keynesian macromodel Y=(C0+G+I) / (1-c) where C0 is autonomus consumption, G is government consumption expenditure, I is investment expenditure, c is the marginal propensity to consume. In this model, if lthere is an increse in both labor productivity and the marginal propensity to consume while autonomus expenditures remain unchanged, what will happen to the level of employment? a. can't say for sure b. decreses c. stays the same d. increases
- Suppose that due ot a fiscal stimulus, there is an increase in disposable incomes of $100 billion in the first round. Then, $33 billion was spent in consumption from this initial change of the disposable incomes. Following the same marginal propensity to consume, how much is the change in consumption spending in the next round from the $33 billion?Consider a closed economy with no government, where aggregate demand is determined by autonomous consumption, investment (which is independent of output), and the marginal propensity to consume. a) Given that autonomous consumption is 20, investment is also 20, and the marginal propensity to consume is 0.6, write out an equation for aggregate demand (AD) in this economy. b) Given this aggregate demand equation, and the equilibrium equation Y = AD, use algebra to find the equilibrium level of Y. (2 marks) c) Draw a diagram with output (Y) on the x-axis and aggregate demand (AD) on the yaxis. Draw two lines on this diagram: (i) Y = AD, and (ii) the aggregate demand function from part (a). Label the intercept of the AD line, and the point where the two lines intersect, with numerical values. d) Suppose that the marginal propensity to consume falls from 0.6 to 0.5. What would the new equilibrium level of Y be? Illustrate your answer in the diagram you drew for part (c). e)…Elaborate on the difference between a binding and non-binding borrowing constraints and thetwo consumption functions that result.b. From the Intertemporal Choice Model, many theories (non-Keynesian theories ofConsumption) came into being. Using graphical and mathematical expressions, compareand contrast the following theories on consumption behaviours:i. Franco Modigliani: Life-Cycle Hypothesisii. Milton Friedman: Permanent-Income Hypothesisiii. Robert Hall: Random Walk Hypothesis