The heights of fully grown trees of a specific species are normally distributed, with a mean of 66.5 feet and a standard deviation of 5.00 feet. Random samples of size 10 are drawn from the population. Use the central limit theorem to find the mean and standard error of the sampling o sampling distribution. The mean of the sampling distribution is ;"U- The standard error of the sampling distribution is o;"- (Round to two decimal places as needed.) Choose the correct graph of the sampling distribution below. OA. OB. Oc. 633 66.5 66.7 s6.5 66.5 76.5
The heights of fully grown trees of a specific species are normally distributed, with a mean of 66.5 feet and a standard deviation of 5.00 feet. Random samples of size 10 are drawn from the population. Use the central limit theorem to find the mean and standard error of the sampling o sampling distribution. The mean of the sampling distribution is ;"U- The standard error of the sampling distribution is o;"- (Round to two decimal places as needed.) Choose the correct graph of the sampling distribution below. OA. OB. Oc. 633 66.5 66.7 s6.5 66.5 76.5

MATLAB: An Introduction with Applications
6th Edition
ISBN:9781119256830
Author:Amos Gilat
Publisher:Amos Gilat
Chapter1: Starting With Matlab
Section: Chapter Questions
Problem 1P

Related questions

Question
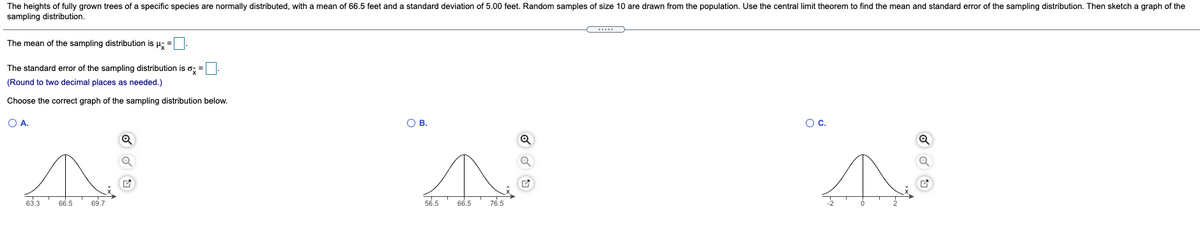
Transcribed Image Text:The heights of fully grown trees of a specific species are normally distributed, with a mean of 66.5 feet and a standard deviation of 5.00 feet. Random samples of size 10 are drawn from the population. Use the central limit theorem to find the mean and standard error of the sampling distribution. Then sketch a graph of the
sampling distribution.
....
The mean of the sampling distribution is µ; =.
The standard error of the sampling distribution is o; =
(Round to two decimal places as needed.)
Choose the correct graph of the sampling distribution below.
O A.
O B.
Oc.
63.3
66.5
69.7
56.5
66.5
76.5
Expert Solution
This question has been solved!
Explore an expertly crafted, step-by-step solution for a thorough understanding of key concepts.

This is a popular solution!

Trending now
This is a popular solution!

Step by step
Solved in 2 steps with 1 images

Knowledge Booster


Learn more about
Need a deep-dive on the concept behind this application? Look no further. Learn more about this topic, statistics and related others by exploring similar questions and additional content below.Recommended textbooks for you
MATLAB: An Introduction with Applications
Statistics
ISBN:
9781119256830
Author:
Amos Gilat
Publisher:
John Wiley & Sons Inc

Probability and Statistics for Engineering and th…
Statistics
ISBN:
9781305251809
Author:
Jay L. Devore
Publisher:
Cengage Learning

Statistics for The Behavioral Sciences (MindTap C…
Statistics
ISBN:
9781305504912
Author:
Frederick J Gravetter, Larry B. Wallnau
Publisher:
Cengage Learning
MATLAB: An Introduction with Applications
Statistics
ISBN:
9781119256830
Author:
Amos Gilat
Publisher:
John Wiley & Sons Inc
Probability and Statistics for Engineering and th…
Statistics
ISBN:
9781305251809
Author:
Jay L. Devore
Publisher:
Cengage Learning
Statistics for The Behavioral Sciences (MindTap C…
Statistics
ISBN:
9781305504912
Author:
Frederick J Gravetter, Larry B. Wallnau
Publisher:
Cengage Learning

Elementary Statistics: Picturing the World (7th E…
Statistics
ISBN:
9780134683416
Author:
Ron Larson, Betsy Farber
Publisher:
PEARSON

The Basic Practice of Statistics
Statistics
ISBN:
9781319042578
Author:
David S. Moore, William I. Notz, Michael A. Fligner
Publisher:
W. H. Freeman

Introduction to the Practice of Statistics
Statistics
ISBN:
9781319013387
Author:
David S. Moore, George P. McCabe, Bruce A. Craig
Publisher:
W. H. Freeman