A manufacturer suspects a difference in the quality of the spare narts he receives from two suppliers. He obtains the following data on the service life of random samples of parts from two suypliers. Standard Supplier Number in Sample Means Deviation 50 150 10 100 153 Test whether the difference between the two sample means is statisically significant at the 1% level of significance
A manufacturer suspects a difference in the quality of the spare narts he receives from two suppliers. He obtains the following data on the service life of random samples of parts from two suypliers. Standard Supplier Number in Sample Means Deviation 50 150 10 100 153 Test whether the difference between the two sample means is statisically significant at the 1% level of significance

Glencoe Algebra 1, Student Edition, 9780079039897, 0079039898, 2018
18th Edition
ISBN:9780079039897
Author:Carter
Publisher:Carter
Chapter10: Statistics
Section10.1: Measures Of Center
Problem 9PPS

Related questions
Topic Video
Question
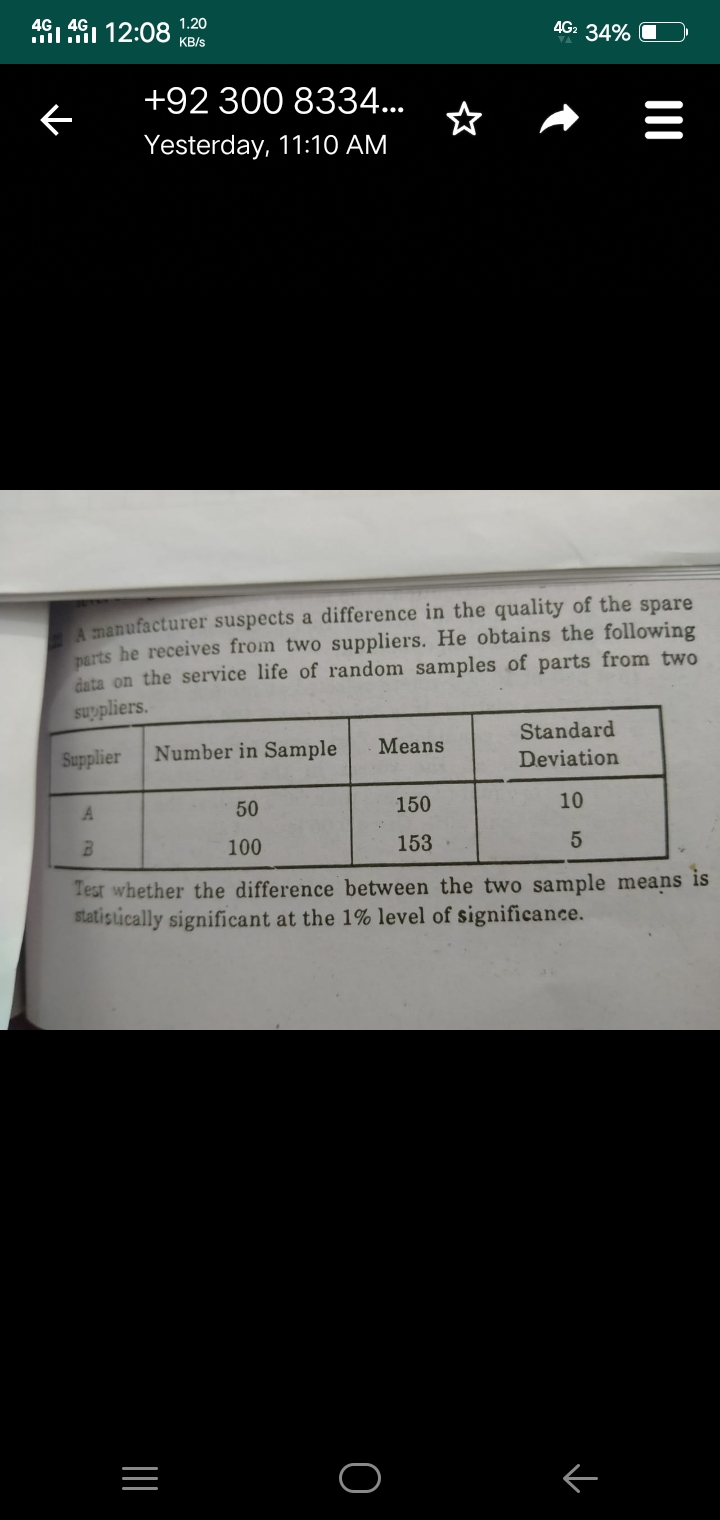
A manufacturer suspects a difference in the quality of the spare
narts he receives from two suppliers. He obtains the following
data on the service life of random samples of parts from two
suypliers.
Standard
Supplier
Number in Sample
Means
Deviation
50
150
10
100
153
Test whether the difference between the two sample means is
statisically significant at the 1% level of significance.
Transcribed Image Text:I 1 12:08 1.20
4G2 34%
KB/s
+92 300 8334...
Yesterday, 11:10 AM
A manufacturer suspects a difference in the quality of the spare
narts he receives from two suppliers. He obtains the following
data on the service life of random samples of parts from two
suppliers.
Standard
Supplier
Number in Sample
Means
Deviation
50
150
10
100
153
Tesr whether the difference between the two sample means is
statistically significant at the 1% level of significance.
Expert Solution
This question has been solved!
Explore an expertly crafted, step-by-step solution for a thorough understanding of key concepts.

Step by step
Solved in 2 steps

Knowledge Booster


Learn more about
Need a deep-dive on the concept behind this application? Look no further. Learn more about this topic, statistics and related others by exploring similar questions and additional content below.Recommended textbooks for you
Glencoe Algebra 1, Student Edition, 9780079039897…
Algebra
ISBN:
9780079039897
Author:
Carter
Publisher:
McGraw Hill
Glencoe Algebra 1, Student Edition, 9780079039897…
Algebra
ISBN:
9780079039897
Author:
Carter
Publisher:
McGraw Hill