Let X₁, X2, X3 be independent & identically distributed standard normal random variables and let Y₁ ~ N(1,4) and Y₂ ~ N(0.9) where Y, and Y₂ are independent & also independent of the Xis, i=1,2,3. a) Give the joint pdf of X₁, X₂, X3 b.) What is the variance of ×? c.) Compute the covariance between X₁ X₂ +3X3 and 2Y₁ + Y3 d). Compute the X₁ X₂ + 3X3 correlation coefficient between and 2Y₁ + Y3.
Let X₁, X2, X3 be independent & identically distributed standard normal random variables and let Y₁ ~ N(1,4) and Y₂ ~ N(0.9) where Y, and Y₂ are independent & also independent of the Xis, i=1,2,3. a) Give the joint pdf of X₁, X₂, X3 b.) What is the variance of ×? c.) Compute the covariance between X₁ X₂ +3X3 and 2Y₁ + Y3 d). Compute the X₁ X₂ + 3X3 correlation coefficient between and 2Y₁ + Y3.

Algebra & Trigonometry with Analytic Geometry
13th Edition
ISBN:9781133382119
Author:Swokowski
Publisher:Swokowski
Chapter10: Sequences, Series, And Probability
Section10.8: Probability
Problem 31E

Related questions
Question
show solutions
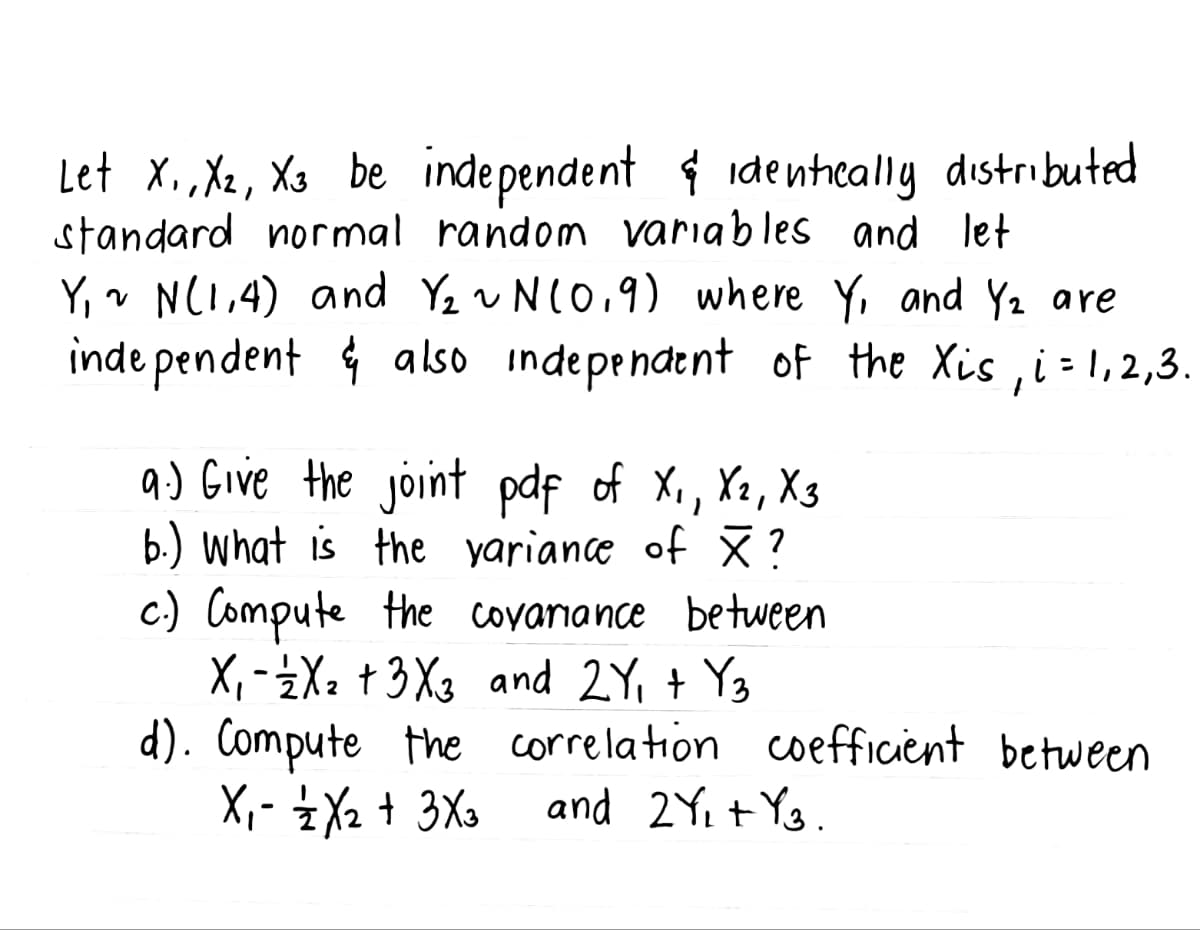
Transcribed Image Text:Let X₁, X2, X3 be independent & identically distributed
standard normal random variables and let
Y₁ ~ N(1,4) and Y₂ ~ N(0.9) where Y, and Y₂ are
independent & also independent of the Xis, i = 1,2,3.
9.) Give the joint pdf of X₁, X2, X3
b.) What is the variance of ×?
c.) Compute the covariance between
X₁ X₂ +3X3 and 2Y₁ + Y3
-
d). Compute the
X₁ - 12/2X₂ + 3X3
correlation coefficient between
and 2Y₁+ Y3.
Expert Solution
This question has been solved!
Explore an expertly crafted, step-by-step solution for a thorough understanding of key concepts.

Step by step
Solved in 4 steps

Recommended textbooks for you
Algebra & Trigonometry with Analytic Geometry
Algebra
ISBN:
9781133382119
Author:
Swokowski
Publisher:
Cengage
Algebra & Trigonometry with Analytic Geometry
Algebra
ISBN:
9781133382119
Author:
Swokowski
Publisher:
Cengage