The Johnson Research Organization, a nonprofit organization that does not pay taxes, is considering buying laboratory equipment with an estimated life of seven years so it will not have to use outsiders' laboratories for certain types of work. The following are all of the cash flows affected by the decision: Use Exhibit A.8. Investment (outflow at time 0) Periodic operating cash flows: Annual cash savings because outside laboratories are not used Additional cash outflow for people and supplies to operate the equipment Salvage value after seven years, which is the estimated life of this project $5,300,000 1,530,000 330,000 530,000 Discount rate 14% Required: Calculate the net present value of this decision. (Round PV factor to 3 decimal places.) Net present value Should the organization buy the equipment? O Yes O No Exhibit A.8 Present Value of $1 Year 6% 8% 10% 12% 14% 15% 16% 18% 20% 0.952 0.943 0.926 0.909 0.893 0.877 0.870 0.862 0.847 0.833 0.907 0.890 0.857 0.826 0.797 0.769 0.756 0.743 0.718 0.694 0.864 0.840 0.794 0.751 0.712 0.675 0.658 0.641 0.609 0.579 4 0.823 0.792 0.735 0.683 0.636 0.592 0.572 0.552 0.516 0.482 0.784 0.747 0.681 0.621 0.567 0.519 0.497 0.476 0.437 0,402 0.746 0.705 0.630 0.564 0.507 0.456 0.432 0.410 0.370 0.335 0.711 0.665 0.583 0.513 0.452 0.400 0.376 0.354 0.314 0.279 0.677 0.627 0.540 0.467 0.404 0.351 0.327 0.305 0.266 0.233 0.645 0.592 0.500 0.424 0.361 0.308 0.284 0.263 0.225 0.194 10 0.614 0.558 0.463 0.386 0.322 0.270 0.247 0.227 0.191 0.162 11 0.585 0.527 0.429 0.350 0.287 0.237 0.215 0.195 0.162 0.135 12 0.557 0.497 0.397 0.319 0.257 0.208 0.187 0.168 0.137 0.112 13 0.530 0.469 0.368 0.290 0.229 0.182 0.163 0.145 0.116 0.093 14 0.505 0.442 0.340 0.263 0.205 0.160 0.141 0.125 0.099 0.078 15 0.481 0.417 0.315 0.239 0.183 0.140 0.123 0.108 0.084 0.065 Year 22% 24% 25% 26% 28% 30% 32% 34% 35% 40% 0.820 0.806 0.S00 0.794 0.781 0.769 0.758 0.746 0.741 0.714 0.672 0.650 0.640 0.630 0.610 0.592 0.574 0.557 0.549 0.510 0.551 0.524 0.512 0.500 0.477 0.455 0.435 0.416 0.406 0.364 4 0.451 0.423 0.410 0.397 0.373 0.350 0.329 0.310 0.301 0.260 0.370 0.341 0.328 0.315 0.291 0.269 0.250 0.231 0.223 0.186 0.303 0.275 0.262 0.250 0.227 0.207 0.189 0.173 0.165 0.133 0.249 0.222 0.210 0.198 0.178 0.159 0.143 0.129 0.122 0.095 0.204 0.179 0.168 0.157 0.139 0.123 0.108 0.096 0.091 0,068 0.167 0.144 0.134 0.125 0.108 0.094 0.082 0.072 0.067 0.048 10 0.137 0.116 0.107 0.099 0.085 0.073 0.062 0.054 0.050 0.035 11 0.112 0.094 0.086 0.079 0.066 0.056 0.047 0.040 0.037 0.025 12 0.092 0.076 0.069 0.062 0.052 0.043 0.036 0.030 0.027 0.018 13 0.075 0.061 0.055 0.050 0.040 0.033 0.027 0.022 0.020 0.013 14 0.062 0.049 0.044 0.039 0.032 0.025 0.021 0.017 0.015 0.009 15 0.051 0.040 0.035 0.031 0.025 0.020 0.016 0.012 0.011 0.006 3. 7. 2. 3.
The Johnson Research Organization, a nonprofit organization that does not pay taxes, is considering buying laboratory equipment with an estimated life of seven years so it will not have to use outsiders' laboratories for certain types of work. The following are all of the cash flows affected by the decision: Use Exhibit A.8. Investment (outflow at time 0) Periodic operating cash flows: Annual cash savings because outside laboratories are not used Additional cash outflow for people and supplies to operate the equipment Salvage value after seven years, which is the estimated life of this project $5,300,000 1,530,000 330,000 530,000 Discount rate 14% Required: Calculate the net present value of this decision. (Round PV factor to 3 decimal places.) Net present value Should the organization buy the equipment? O Yes O No Exhibit A.8 Present Value of $1 Year 6% 8% 10% 12% 14% 15% 16% 18% 20% 0.952 0.943 0.926 0.909 0.893 0.877 0.870 0.862 0.847 0.833 0.907 0.890 0.857 0.826 0.797 0.769 0.756 0.743 0.718 0.694 0.864 0.840 0.794 0.751 0.712 0.675 0.658 0.641 0.609 0.579 4 0.823 0.792 0.735 0.683 0.636 0.592 0.572 0.552 0.516 0.482 0.784 0.747 0.681 0.621 0.567 0.519 0.497 0.476 0.437 0,402 0.746 0.705 0.630 0.564 0.507 0.456 0.432 0.410 0.370 0.335 0.711 0.665 0.583 0.513 0.452 0.400 0.376 0.354 0.314 0.279 0.677 0.627 0.540 0.467 0.404 0.351 0.327 0.305 0.266 0.233 0.645 0.592 0.500 0.424 0.361 0.308 0.284 0.263 0.225 0.194 10 0.614 0.558 0.463 0.386 0.322 0.270 0.247 0.227 0.191 0.162 11 0.585 0.527 0.429 0.350 0.287 0.237 0.215 0.195 0.162 0.135 12 0.557 0.497 0.397 0.319 0.257 0.208 0.187 0.168 0.137 0.112 13 0.530 0.469 0.368 0.290 0.229 0.182 0.163 0.145 0.116 0.093 14 0.505 0.442 0.340 0.263 0.205 0.160 0.141 0.125 0.099 0.078 15 0.481 0.417 0.315 0.239 0.183 0.140 0.123 0.108 0.084 0.065 Year 22% 24% 25% 26% 28% 30% 32% 34% 35% 40% 0.820 0.806 0.S00 0.794 0.781 0.769 0.758 0.746 0.741 0.714 0.672 0.650 0.640 0.630 0.610 0.592 0.574 0.557 0.549 0.510 0.551 0.524 0.512 0.500 0.477 0.455 0.435 0.416 0.406 0.364 4 0.451 0.423 0.410 0.397 0.373 0.350 0.329 0.310 0.301 0.260 0.370 0.341 0.328 0.315 0.291 0.269 0.250 0.231 0.223 0.186 0.303 0.275 0.262 0.250 0.227 0.207 0.189 0.173 0.165 0.133 0.249 0.222 0.210 0.198 0.178 0.159 0.143 0.129 0.122 0.095 0.204 0.179 0.168 0.157 0.139 0.123 0.108 0.096 0.091 0,068 0.167 0.144 0.134 0.125 0.108 0.094 0.082 0.072 0.067 0.048 10 0.137 0.116 0.107 0.099 0.085 0.073 0.062 0.054 0.050 0.035 11 0.112 0.094 0.086 0.079 0.066 0.056 0.047 0.040 0.037 0.025 12 0.092 0.076 0.069 0.062 0.052 0.043 0.036 0.030 0.027 0.018 13 0.075 0.061 0.055 0.050 0.040 0.033 0.027 0.022 0.020 0.013 14 0.062 0.049 0.044 0.039 0.032 0.025 0.021 0.017 0.015 0.009 15 0.051 0.040 0.035 0.031 0.025 0.020 0.016 0.012 0.011 0.006 3. 7. 2. 3.

Cornerstones of Cost Management (Cornerstones Series)
4th Edition
ISBN:9781305970663
Author:Don R. Hansen, Maryanne M. Mowen
Publisher:Don R. Hansen, Maryanne M. Mowen
Chapter19: Capital Investment
Section: Chapter Questions
Problem 25P

Related questions
Question
Calculate the
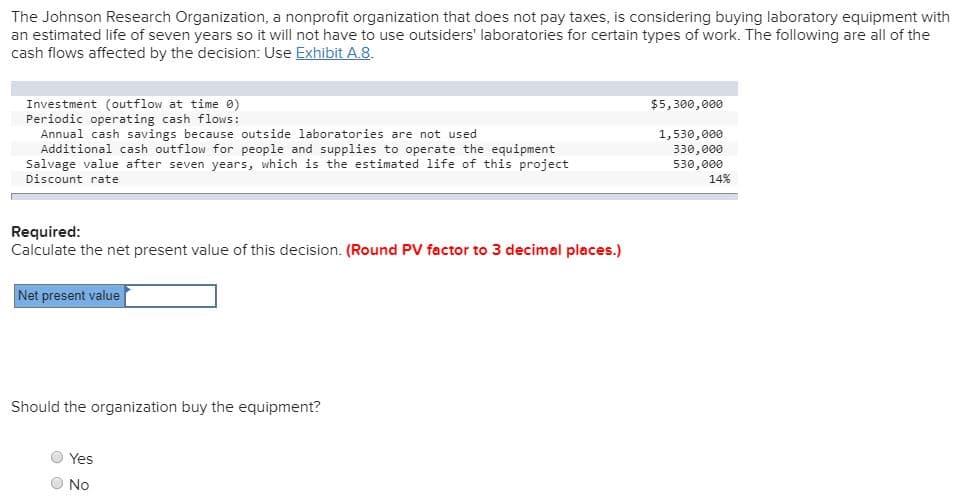
Transcribed Image Text:The Johnson Research Organization, a nonprofit organization that does not pay taxes, is considering buying laboratory equipment with
an estimated life of seven years so it will not have to use outsiders' laboratories for certain types of work. The following are all of the
cash flows affected by the decision: Use Exhibit A.8.
Investment (outflow at time 0)
Periodic operating cash flows:
Annual cash savings because outside laboratories are not used
Additional cash outflow for people and supplies to operate the equipment
Salvage value after seven years, which is the estimated life of this project
$5,300,000
1,530,000
330,000
530,000
Discount rate
14%
Required:
Calculate the net present value of this decision. (Round PV factor to 3 decimal places.)
Net present value
Should the organization buy the equipment?
O Yes
O No
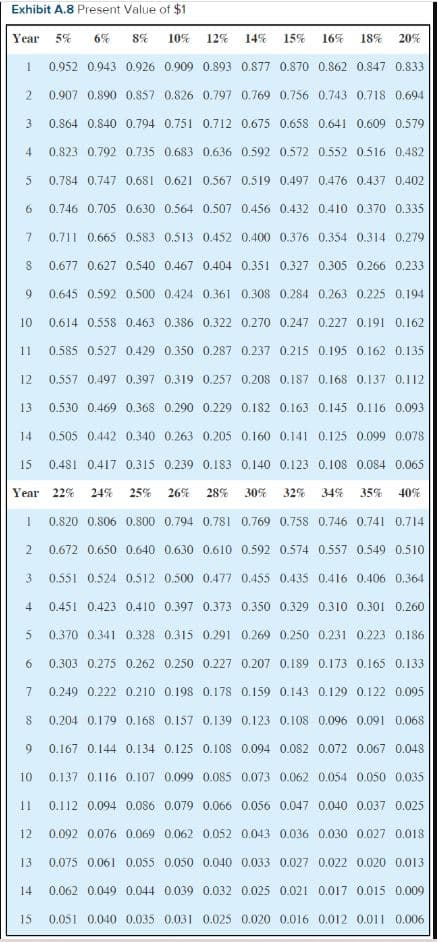
Transcribed Image Text:Exhibit A.8 Present Value of $1
Year
6%
8%
10%
12% 14% 15%
16%
18%
20%
0.952 0.943 0.926 0.909 0.893 0.877 0.870 0.862 0.847 0.833
0.907 0.890 0.857 0.826 0.797 0.769 0.756 0.743 0.718 0.694
0.864 0.840 0.794 0.751 0.712 0.675 0.658 0.641 0.609 0.579
4
0.823 0.792 0.735 0.683 0.636 0.592 0.572 0.552 0.516 0.482
0.784 0.747 0.681 0.621 0.567 0.519 0.497 0.476 0.437 0,402
0.746 0.705 0.630 0.564 0.507 0.456 0.432 0.410 0.370 0.335
0.711 0.665 0.583 0.513 0.452 0.400 0.376 0.354 0.314 0.279
0.677 0.627 0.540 0.467 0.404 0.351 0.327 0.305 0.266 0.233
0.645 0.592 0.500 0.424 0.361 0.308 0.284 0.263 0.225 0.194
10
0.614 0.558 0.463 0.386 0.322 0.270 0.247 0.227 0.191 0.162
11
0.585 0.527 0.429 0.350 0.287 0.237 0.215 0.195 0.162 0.135
12
0.557 0.497 0.397 0.319 0.257 0.208 0.187 0.168 0.137 0.112
13
0.530 0.469 0.368 0.290 0.229 0.182 0.163 0.145 0.116 0.093
14
0.505 0.442 0.340 0.263 0.205 0.160 0.141 0.125 0.099 0.078
15
0.481 0.417 0.315 0.239 0.183 0.140 0.123 0.108 0.084 0.065
Year 22%
24%
25%
26%
28%
30%
32%
34%
35%
40%
0.820 0.806 0.S00 0.794 0.781 0.769 0.758 0.746 0.741 0.714
0.672 0.650 0.640 0.630 0.610 0.592 0.574 0.557 0.549 0.510
0.551 0.524 0.512 0.500 0.477 0.455 0.435 0.416 0.406 0.364
4
0.451 0.423 0.410 0.397 0.373 0.350 0.329 0.310 0.301 0.260
0.370 0.341 0.328 0.315 0.291 0.269 0.250 0.231 0.223 0.186
0.303 0.275 0.262 0.250 0.227 0.207 0.189 0.173 0.165 0.133
0.249 0.222 0.210 0.198 0.178 0.159 0.143 0.129 0.122 0.095
0.204 0.179 0.168 0.157 0.139 0.123 0.108 0.096 0.091 0,068
0.167 0.144 0.134 0.125 0.108 0.094 0.082 0.072 0.067 0.048
10
0.137 0.116 0.107 0.099 0.085 0.073 0.062 0.054 0.050 0.035
11
0.112 0.094 0.086 0.079 0.066 0.056 0.047 0.040 0.037 0.025
12
0.092 0.076 0.069 0.062 0.052 0.043 0.036 0.030 0.027 0.018
13
0.075 0.061 0.055 0.050 0.040 0.033 0.027 0.022 0.020 0.013
14
0.062 0.049 0.044 0.039 0.032 0.025 0.021 0.017 0.015 0.009
15
0.051 0.040 0.035 0.031 0.025 0.020 0.016 0.012 0.011 0.006
3.
7.
2.
3.
Expert Solution
This question has been solved!
Explore an expertly crafted, step-by-step solution for a thorough understanding of key concepts.

This is a popular solution!

Trending now
This is a popular solution!

Step by step
Solved in 2 steps with 2 images

Knowledge Booster


Learn more about
Need a deep-dive on the concept behind this application? Look no further. Learn more about this topic, accounting and related others by exploring similar questions and additional content below.Recommended textbooks for you
Cornerstones of Cost Management (Cornerstones Ser…
Accounting
ISBN:
9781305970663
Author:
Don R. Hansen, Maryanne M. Mowen
Publisher:
Cengage Learning

Intermediate Financial Management (MindTap Course…
Finance
ISBN:
9781337395083
Author:
Eugene F. Brigham, Phillip R. Daves
Publisher:
Cengage Learning

Excel Applications for Accounting Principles
Accounting
ISBN:
9781111581565
Author:
Gaylord N. Smith
Publisher:
Cengage Learning
Cornerstones of Cost Management (Cornerstones Ser…
Accounting
ISBN:
9781305970663
Author:
Don R. Hansen, Maryanne M. Mowen
Publisher:
Cengage Learning
Intermediate Financial Management (MindTap Course…
Finance
ISBN:
9781337395083
Author:
Eugene F. Brigham, Phillip R. Daves
Publisher:
Cengage Learning
Excel Applications for Accounting Principles
Accounting
ISBN:
9781111581565
Author:
Gaylord N. Smith
Publisher:
Cengage Learning

EBK CONTEMPORARY FINANCIAL MANAGEMENT
Finance
ISBN:
9781337514835
Author:
MOYER
Publisher:
CENGAGE LEARNING - CONSIGNMENT

Principles of Accounting Volume 2
Accounting
ISBN:
9781947172609
Author:
OpenStax
Publisher:
OpenStax College
