The joint probability mass function of X and Y is given by p(1, 1) = 0.4 p(1,2) = 0.1 p(1,3) = 0.05 p(2, 1) = 0.05 p(2, 2) = 0.05 p(2, 3) = 0.05 p(3, 1) = 0.1 p(3, 2) = 0.1 p(3, 3) = 0.1 (a) Compute the conditional mass function of Y given X = 3: P(Y = 1|X = 3) = %3D P(Y = 2|X = 3) = %3D P(Y = 3|X = 3) = (b) Are X and Y independent? (enter YES or NO) (c) Compute the following probabilities: P(X+Y > 2) = %3D P(XY = 2) = P(주 > 1) =
The joint probability mass function of X and Y is given by p(1, 1) = 0.4 p(1,2) = 0.1 p(1,3) = 0.05 p(2, 1) = 0.05 p(2, 2) = 0.05 p(2, 3) = 0.05 p(3, 1) = 0.1 p(3, 2) = 0.1 p(3, 3) = 0.1 (a) Compute the conditional mass function of Y given X = 3: P(Y = 1|X = 3) = %3D P(Y = 2|X = 3) = %3D P(Y = 3|X = 3) = (b) Are X and Y independent? (enter YES or NO) (c) Compute the following probabilities: P(X+Y > 2) = %3D P(XY = 2) = P(주 > 1) =

MATLAB: An Introduction with Applications
6th Edition
ISBN:9781119256830
Author:Amos Gilat
Publisher:Amos Gilat
Chapter1: Starting With Matlab
Section: Chapter Questions
Problem 1P

Related questions

Question
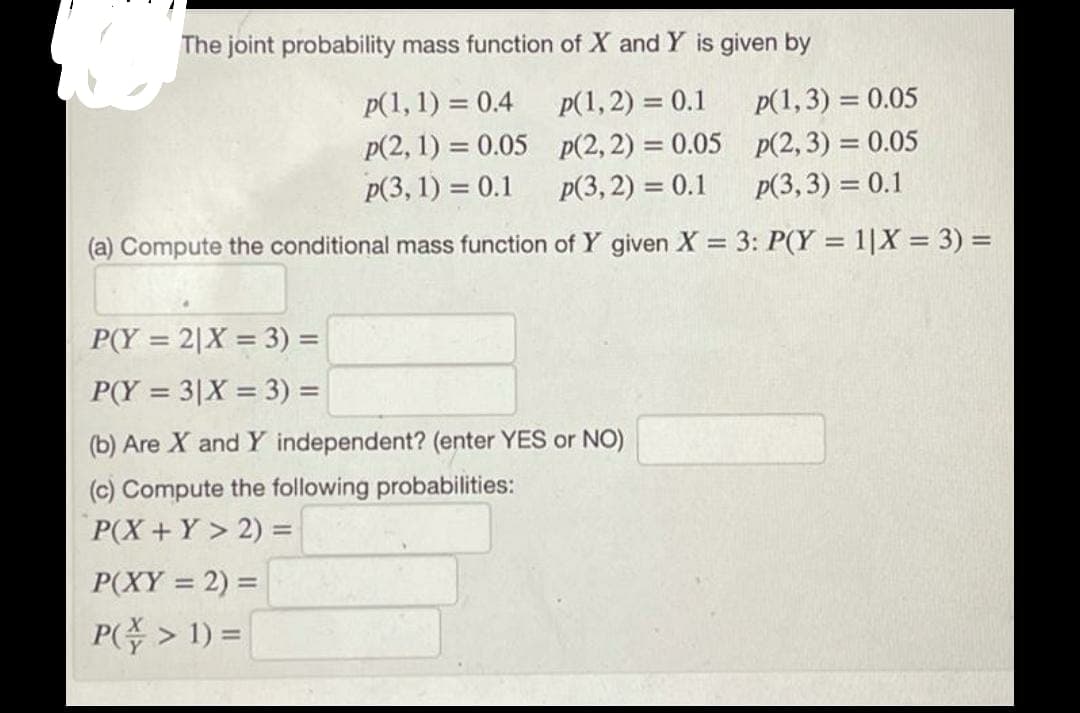
Transcribed Image Text:The joint probability mass function of X and Y is given by
p(1, 1) = 0.4
p(1, 2) = 0.1
p(1,3) = 0.05
p(2, 1) = 0.05 p(2, 2) = 0.05 p(2,3) = 0.05
p(3, 2) = 0.1
p(3, 1) = 0.1
p(3,3) = 0.1
(a) Compute the conditional mass function of Y given X = 3: P(Y = 1|X = 3) =
P(Y = 2|X = 3) =
%3D
P(Y = 3|X = 3) =
(b) Are X and Y independent? (enter YES or NO)
(c) Compute the following probabilities:
P(X+Y > 2) =
%3D
P(XY = 2) =
P(주> 1) =
%3D
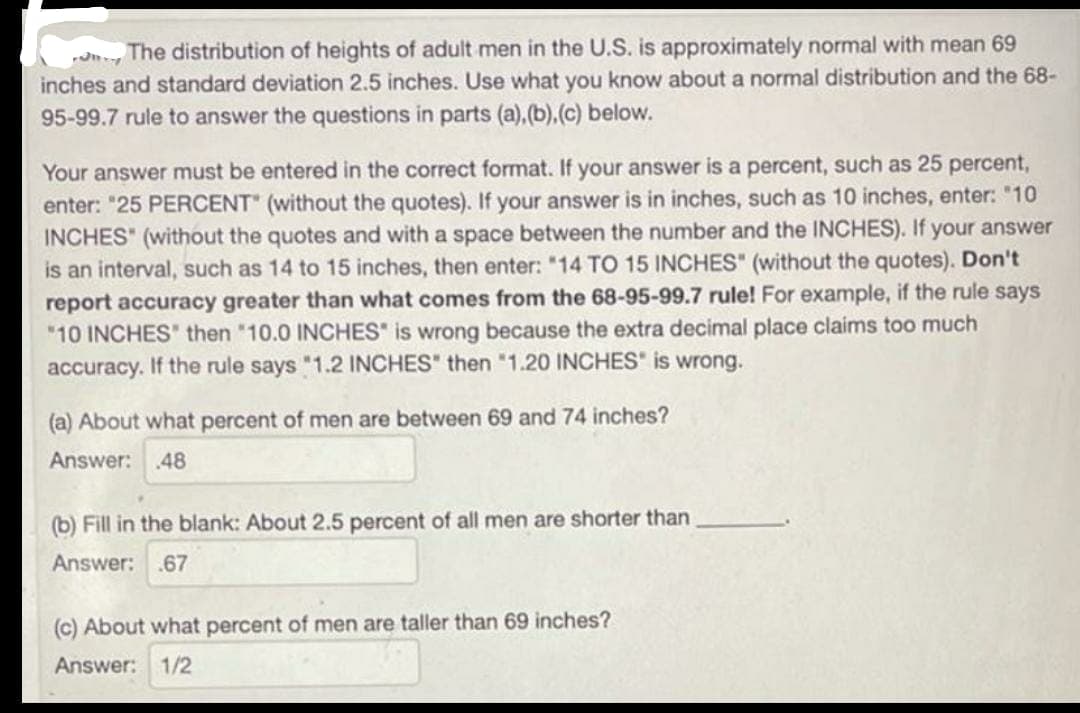
Transcribed Image Text:The distribution of heights of adult men in the U.S. is approximately normal with mean 69
inches and standard deviation 2.5 inches. Use what you know about a normal distribution and the 68-
95-99.7 rule to answer the questions in parts (a),(b),(c) below.
Your answer must be entered in the correct format. If your answer is a percent, such as 25 percent,
enter: "25 PERCENT" (without the quotes). If your answer is in inches, such as 10 inches, enter: "10
INCHES" (without the quotes and with a space between the number and the INCHES). If your answer
is an interval, such as 14 to 15 inches, then enter: "14 TO 15 INCHES" (without the quotes). Don't
report accuracy greater than what comes from the 68-95-99.7 rule! For example, if the rule says
"10 INCHES then "10.0 INCHES" is wrong because the extra decimal place claims too much
accuracy. If the rule says "1.2 INCHES" then "1.20 INCHES" is wrong.
(a) About what percent of men are between 69 and 74 inches?
Answer: .48
(b) Fill in the blank: About 2.5 percent of all men are shorter than
Answer: .67
(c) About what percent of men are taller than 69 inches?
Answer: 1/2
Expert Solution
This question has been solved!
Explore an expertly crafted, step-by-step solution for a thorough understanding of key concepts.

This is a popular solution!

Trending now
This is a popular solution!

Step by step
Solved in 2 steps with 2 images

Knowledge Booster


Learn more about
Need a deep-dive on the concept behind this application? Look no further. Learn more about this topic, statistics and related others by exploring similar questions and additional content below.Recommended textbooks for you
MATLAB: An Introduction with Applications
Statistics
ISBN:
9781119256830
Author:
Amos Gilat
Publisher:
John Wiley & Sons Inc

Probability and Statistics for Engineering and th…
Statistics
ISBN:
9781305251809
Author:
Jay L. Devore
Publisher:
Cengage Learning

Statistics for The Behavioral Sciences (MindTap C…
Statistics
ISBN:
9781305504912
Author:
Frederick J Gravetter, Larry B. Wallnau
Publisher:
Cengage Learning
MATLAB: An Introduction with Applications
Statistics
ISBN:
9781119256830
Author:
Amos Gilat
Publisher:
John Wiley & Sons Inc
Probability and Statistics for Engineering and th…
Statistics
ISBN:
9781305251809
Author:
Jay L. Devore
Publisher:
Cengage Learning
Statistics for The Behavioral Sciences (MindTap C…
Statistics
ISBN:
9781305504912
Author:
Frederick J Gravetter, Larry B. Wallnau
Publisher:
Cengage Learning

Elementary Statistics: Picturing the World (7th E…
Statistics
ISBN:
9780134683416
Author:
Ron Larson, Betsy Farber
Publisher:
PEARSON

The Basic Practice of Statistics
Statistics
ISBN:
9781319042578
Author:
David S. Moore, William I. Notz, Michael A. Fligner
Publisher:
W. H. Freeman

Introduction to the Practice of Statistics
Statistics
ISBN:
9781319013387
Author:
David S. Moore, George P. McCabe, Bruce A. Craig
Publisher:
W. H. Freeman