The Journal de Botanique reported that the mean height of Begonias grown while being treated with a particular nutrient is 36 centimeters. To check whether this is still accurate, heights are measured for a random sample of 14 Begonias grown while being treated with the nutrient. The sample mean and sample standard deviation of those height measurements are 32 centimeters and 11 centimeters, respectively. Assume that the heights of treated Begonias are approximately normally distributed. Based on the sample, can it be concluded that the population mean height of treated begonias, μ, is different from that reported in the journal? Use the 0.10 level of significance.Perform a two-tailed test. Then complete the parts below. Carry your intermediate computations to three or more decimal places. A. Find the value of the test statistic and round to 3 or more decimal places. (I have posted a picture of an example problem and the equation to use, with the correct answer as every expert I have asked thus far has gotten this problem wrong.) B. Find the critical values. (Round to three or more decimal places.) C. Can it be concluded that the mean height of treated Begonias is different from that reported in the journal? (yes or no)


The Journal de Botanique reported that the mean height of Begonias grown while being treated with a particular nutrient is 36 centimeters. To check whether this is still accurate, heights are measured for a random sample of 14 Begonias grown while being treated with the nutrient. The sample mean and sample standard deviation of those height measurements are 32 centimeters and 11 centimeters, respectively. Assume that the heights of treated Begonias are approximately
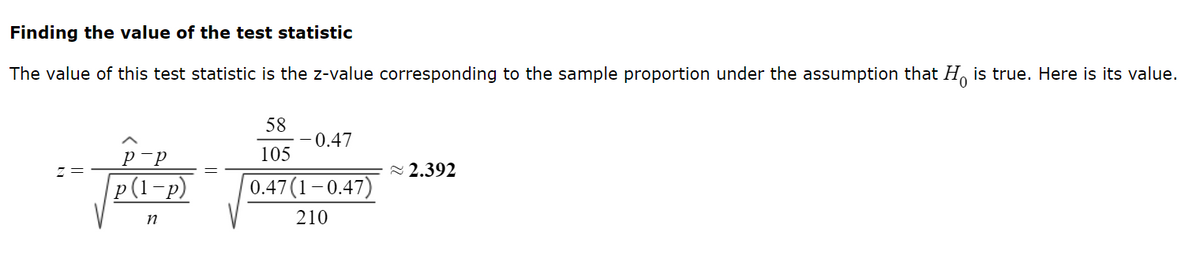
A. Find the value of the test statistic and round to 3 or more decimal places. (I have posted a picture of an example problem and the equation to use, with the correct answer as every expert I have asked thus far has gotten this problem wrong.)
B. Find the critical values. (Round to three or more decimal places.)
C. Can it be concluded that the mean height of treated Begonias is different from that reported in the journal? (yes or no)

Step by step
Solved in 5 steps with 3 images
