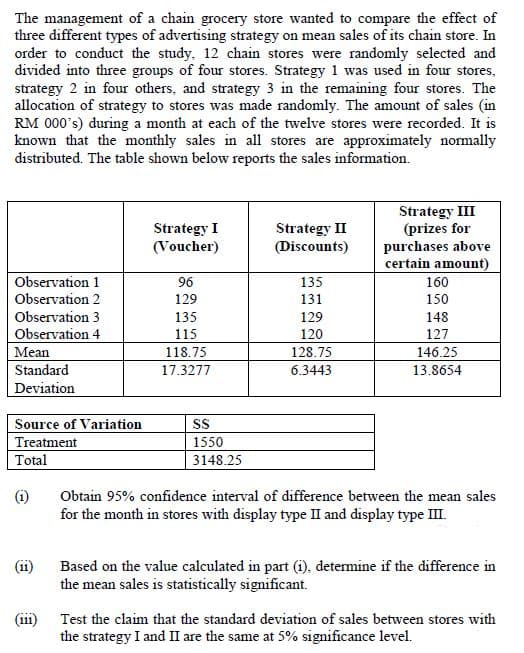
The management of a chain grocery store wanted to compare the effect of three different types of advertising strategy on mean sales of its chain store. In order to conduct the study, 12 chain stores were randomly selected and divided into three groups of four stores. Strategy 1 was used in four stores, strategy 2 in four others, and strategy 3 in the remaining four stores. The allocation of strategy to stores was made randomly. The amount of sales (in RM 000's) during a month at each of the twelve stores were recorded. It is known that the monthly sales in all stores are approximately normally distributed. The table shown below reports the sales information. Strategy III (prizes for purchases above certain amount) Strategy I (Voucher) Strategy II (Discounts) Observation 1 96 135 160 Observation 2 129 131 150 Observation 3 135 129 148


Inverse Normal Distribution
The method used for finding the corresponding z-critical value in a normal distribution using the known probability is said to be an inverse normal distribution. The inverse normal distribution is a continuous probability distribution with a family of two parameters.
Mean, Median, Mode
It is a descriptive summary of a data set. It can be defined by using some of the measures. The central tendencies do not provide information regarding individual data from the dataset. However, they give a summary of the data set. The central tendency or measure of central tendency is a central or typical value for a probability distribution.
Z-Scores
A z-score is a unit of measurement used in statistics to describe the position of a raw score in terms of its distance from the mean, measured with reference to standard deviation from the mean. Z-scores are useful in statistics because they allow comparison between two scores that belong to different normal distributions.
Please use typing to ansewr all as from one subpart.

Step by step
Solved in 2 steps


