Example56. Calculate Mode for the following data: Marks above 10 15 20 25 30 35 40 45 50 55 60 No. of students 100 97 92 85 75 63 48 36 28 20 10 Solution: Th 30
Example56. Calculate Mode for the following data: Marks above 10 15 20 25 30 35 40 45 50 55 60 No. of students 100 97 92 85 75 63 48 36 28 20 10 Solution: Th 30

Glencoe Algebra 1, Student Edition, 9780079039897, 0079039898, 2018
18th Edition
ISBN:9780079039897
Author:Carter
Publisher:Carter
Chapter10: Statistics
Section10.6: Summarizing Categorical Data
Problem 4BGP

Related questions
Question
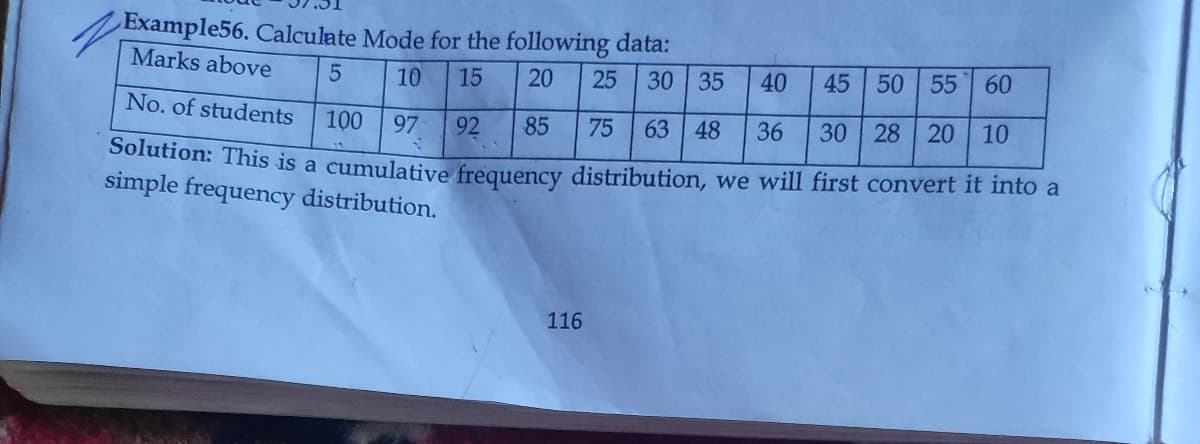
Transcribed Image Text:Example56. Calculate Mode for the following data:
Marks above
10
15
20
25
30 35
40
45 50 55 60
No. of students
100
97
92
85
75
63 48
36
30
28
20
10
Solution: This is a cumulative frequency distribution, we will first convert it into a
simple frequency distribution.
116
Expert Solution
This question has been solved!
Explore an expertly crafted, step-by-step solution for a thorough understanding of key concepts.

Step by step
Solved in 2 steps with 2 images

Recommended textbooks for you
Glencoe Algebra 1, Student Edition, 9780079039897…
Algebra
ISBN:
9780079039897
Author:
Carter
Publisher:
McGraw Hill
Glencoe Algebra 1, Student Edition, 9780079039897…
Algebra
ISBN:
9780079039897
Author:
Carter
Publisher:
McGraw Hill