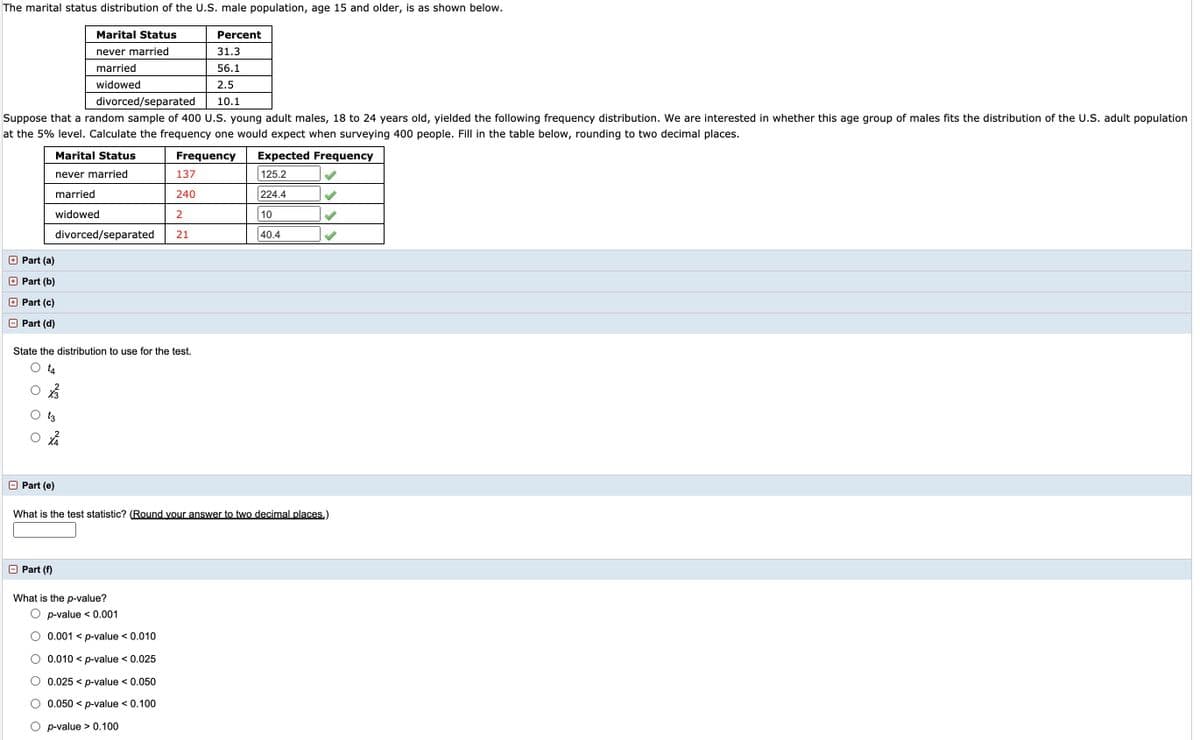
The marital status distribution of the U.S. male population, age 15 and older, is as shown below. Marital Status Percent never married 31.3 married 56.1 widowed 2.5 divorced/separated 10.1 Suppose that a random sample of 400 U.S. young adult males, 18 to 24 years old, yielded the following frequency distribution. We are interested in whether this age group of males fits the distribution of the U.S. adult population at the 5% level. Calculate the frequency one would expect when surveying 400 people. Fill in the table below, rounding to two decimal places. Marital Status Frequency Expected Frequency never married 137 125.2 married 240 224.4 widowed 2 10 divorced/separated 21 40.4 O Part (a) O Part (b) O Part (c) Part (d) State the distribution to use for the test. O Part (e) What is the test statistic? (Round vour answer to two decimal places) O Part (f) What is the p-value? O p-value < 0.001 O 0.001 < p-value <0.010 O 0.010 < p-value < 0.025 O 0.025 < p-value < 0.050 O 0.050 < p-value <0.100 O p-value > 0.100


Unitary Method
The word “unitary” comes from the word “unit”, which means a single and complete entity. In this method, we find the value of a unit product from the given number of products, and then we solve for the other number of products.
Speed, Time, and Distance
Imagine you and 3 of your friends are planning to go to the playground at 6 in the evening. Your house is one mile away from the playground and one of your friends named Jim must start at 5 pm to reach the playground by walk. The other two friends are 3 miles away.
Profit and Loss
The amount earned or lost on the sale of one or more items is referred to as the profit or loss on that item.
Units and Measurements
Measurements and comparisons are the foundation of science and engineering. We, therefore, need rules that tell us how things are measured and compared. For these measurements and comparisons, we perform certain experiments, and we will need the experiments to set up the devices.
I'm stuck on this problem. If you can, please show me how to solve, thank you


Trending now
This is a popular solution!

Step by step
Solved in 3 steps with 1 images


