The median seasonal quarterly sales index of an IT company in Dublin from 2010 to 2013 is as follows: Quarter Median seasonal index 90.456 109.544 3 110.718 89.074 What is the adjusted median seasonal index for Quarter 3 (rounded off to two decimals)? O A. 110.77 O B. 89.12 OC. 109.61 D. 90.50
The median seasonal quarterly sales index of an IT company in Dublin from 2010 to 2013 is as follows: Quarter Median seasonal index 90.456 109.544 3 110.718 89.074 What is the adjusted median seasonal index for Quarter 3 (rounded off to two decimals)? O A. 110.77 O B. 89.12 OC. 109.61 D. 90.50

Glencoe Algebra 1, Student Edition, 9780079039897, 0079039898, 2018
18th Edition
ISBN:9780079039897
Author:Carter
Publisher:Carter
Chapter10: Statistics
Section10.6: Summarizing Categorical Data
Problem 31PPS

Related questions
Question
100%
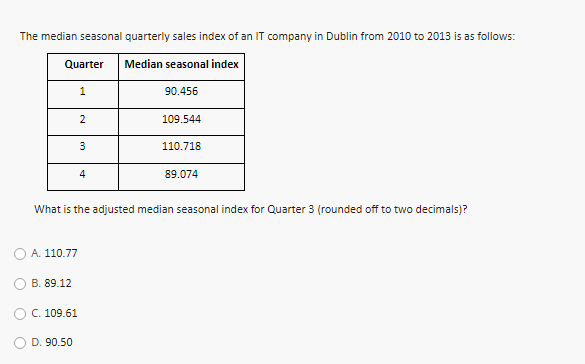
Transcribed Image Text:The median seasonal quarterly sales index of an IT company in Dublin from 2010 to 2013 is as follows:
Quarter
Median seasonal index
90.456
2
109.544
3
110.718
4
89.074
What is the adjusted median seasonal index for Quarter 3 (rounded off to two decimals)?
O A. 110.77
B. 89.12
C. 109.61
D. 90.50
Expert Solution
This question has been solved!
Explore an expertly crafted, step-by-step solution for a thorough understanding of key concepts.

Step by step
Solved in 2 steps with 2 images

Recommended textbooks for you
Glencoe Algebra 1, Student Edition, 9780079039897…
Algebra
ISBN:
9780079039897
Author:
Carter
Publisher:
McGraw Hill
Glencoe Algebra 1, Student Edition, 9780079039897…
Algebra
ISBN:
9780079039897
Author:
Carter
Publisher:
McGraw Hill