For a certain company, the monthly percentages of all shipments received on time over the past 12 months are 80, 82, 84, 83, 84, 84, 85, 84, 82, 83, 85, and 83. (a) Construct a time series plot. 86 86 85 85 84 84 83 80 80
For a certain company, the monthly percentages of all shipments received on time over the past 12 months are 80, 82, 84, 83, 84, 84, 85, 84, 82, 83, 85, and 83. (a) Construct a time series plot. 86 86 85 85 84 84 83 80 80

Algebra & Trigonometry with Analytic Geometry
13th Edition
ISBN:9781133382119
Author:Swokowski
Publisher:Swokowski
Chapter10: Sequences, Series, And Probability
Section10.3: Geometric Sequences
Problem 82E

Related questions
Question
Please answer part B and C
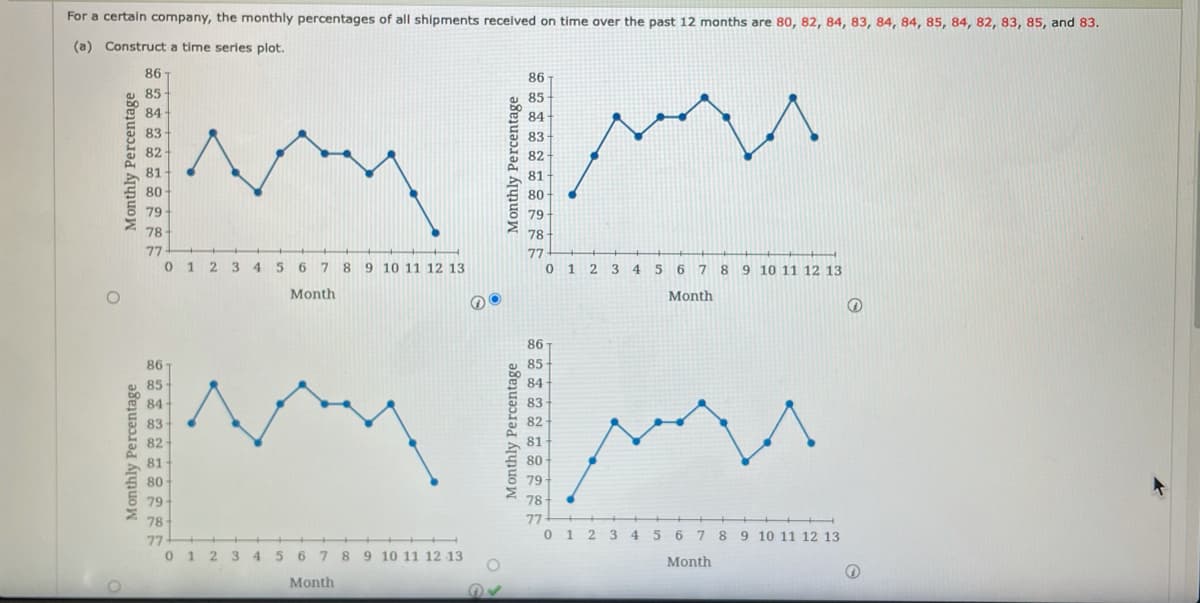
Transcribed Image Text:For a certain company, the monthly percentages of all shipments received on time over the past 12 months are 80, 82, 84, 83, 84, 84, 85, 84, 82, 83, 85, and 83.
(a) Construct a time series plot.
86
86
85
85
84
84
83
83
82
82
81
81
80
80
79
79
78-
78
77
77
0 12 3 45 6 78 9 10 11 12 13
0 1 2 3 456 7 89 10 11 12 13
Month
Month
86
86
85
85
84
84
83
83
82
82
81
81
80
80
79
79
78
77+ +
0 1 2 3 4 5 6 7 89 10 11 12 13
78
77
0 1 2 3 45 6 7 8 9 10 11 12 13
Month
Month
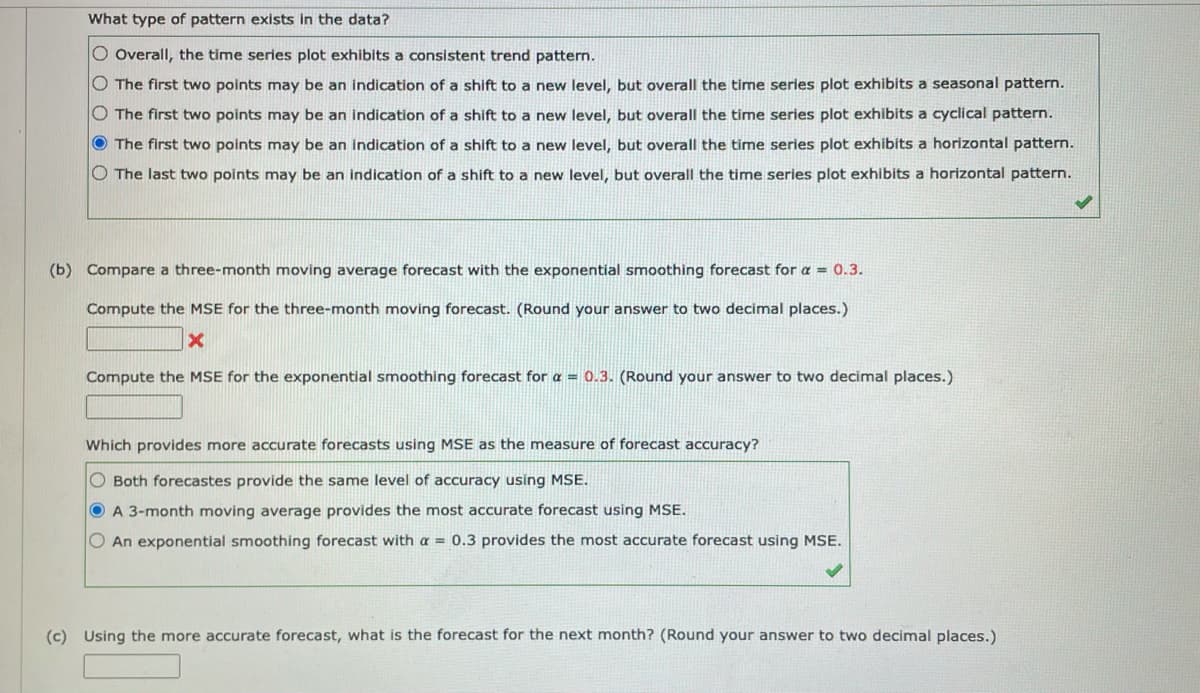
Transcribed Image Text:What type of pattern exists in the data?
O Overall, the time series plot exhibits a consistent trend pattern.
O The first two points may be an indication of a shift to a new level, but overall the time series plot exhibits a seasonal pattern.
O The first two points may be an indication of a shift to a new level, but overall the time series plot exhibits a cyclical pattern.
O The first two points may be an indication of a shift to a new level, but overall the time series plot exhibits a horizontal pattern.
O The last two points may be an indication of a shift to a new level, but overall the time series plot exhibits a horizontal pattern.
(b) Compare a three-month moving average forecast with the exponential smoothing forecast for a = 0.3.
Compute the MSE for the three-month moving forecast. (Round your answer to two decimal places.)
Compute the MSE for the exponential smoothing forecast for a = 0.3. (Round your answer to two decimal places.)
Which provides more accurate forecasts using MSE as the measure of forecast accuracy?
O Both forecastes provide the same level of accuracy using MSE.
A 3-month moving average provides the most accurate forecast using MSE.
An exponential smoothing forecast with a = 0.3 provides the most accurate forecast using MSE.
(c) Using the more accurate forecast, what is the forecast for the next month? (Round your answer to two decimal places.)
Expert Solution
This question has been solved!
Explore an expertly crafted, step-by-step solution for a thorough understanding of key concepts.

This is a popular solution!

Trending now
This is a popular solution!

Step by step
Solved in 3 steps with 6 images

Recommended textbooks for you
Algebra & Trigonometry with Analytic Geometry
Algebra
ISBN:
9781133382119
Author:
Swokowski
Publisher:
Cengage
Algebra & Trigonometry with Analytic Geometry
Algebra
ISBN:
9781133382119
Author:
Swokowski
Publisher:
Cengage