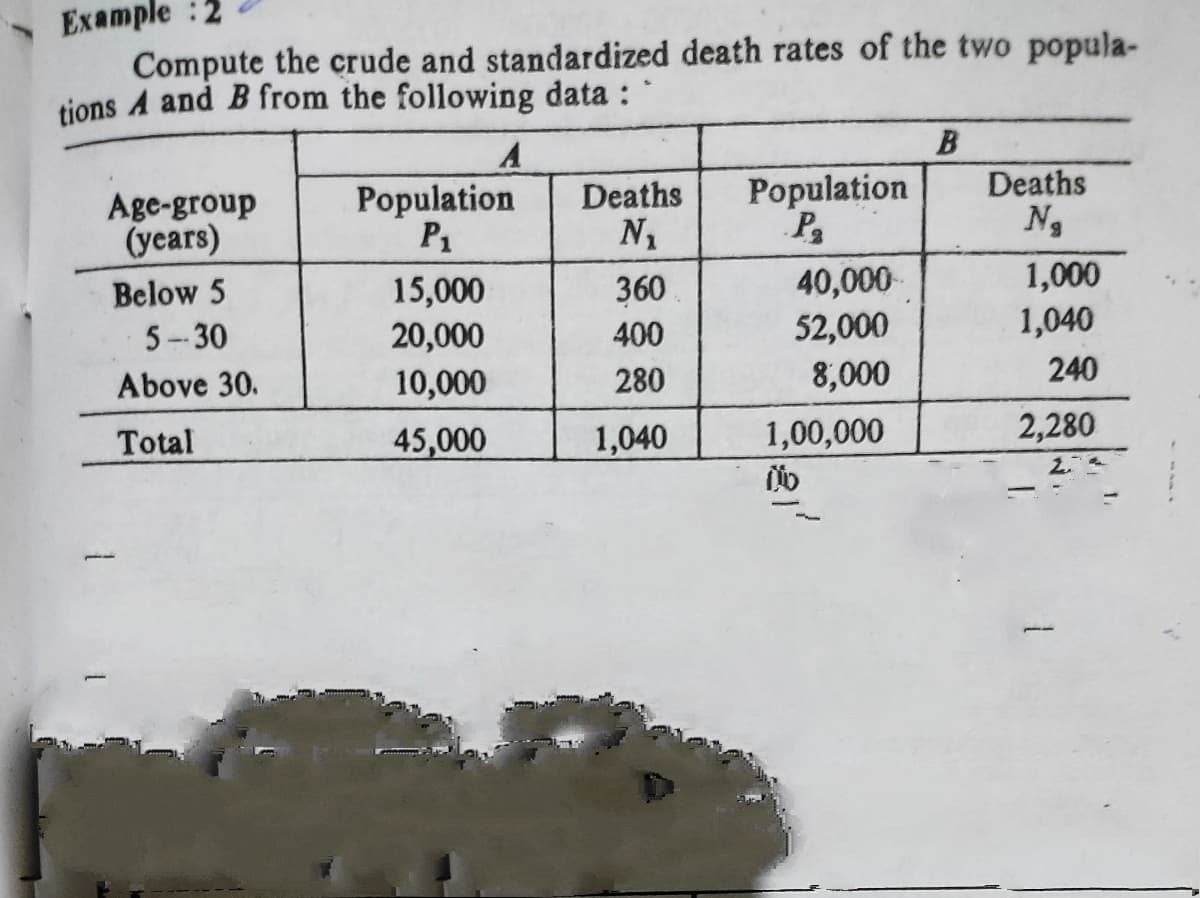
Compute the crude and standardized death rate! tions A and B from the following data : Age-group (years) Population P1 Deaths N1 Population P Deaths Ng 40,000 52,000 1,000 1,040 360. 15,000 20,000 Below 5 5-30 400 Above 30. 10,000 280 8,000 240 Total 45,000 1,040 1,00,000 2,280 2


Q: ABC Company has decided to use 20 test markets to examine the sensitivity of demand for its new…
A: Since you have posted a question with multiple subparts, we will solve first three subparts for you.…
Q: The economic dynamism, which is the index of productive growth (in dollars) for countries that are…
A: vii) For the given sample, Sample mean=43.8727, excel function, =AVERAGE(J1:J26) Sample standard…
Q: The following data represent the length of life in years, measured to the nearest tenth, of 100…
A: Sturge's Formula: K=1+3.3*logN where, K is the number of class intervals, N is the number of…
Q: Cumulative Cumulative Cumulative Relative Percentage Phone Bill Frequency Frequency Frequency…
A: Given Table is : (i) From the given table, we have total frequency is 200. So, the number of people…
Q: From a cross-sectional life table provided, please answer the following c Age group Death Population…
A: Life table is a table that represents the life history of a hypothetical group as it is gradually…
Q: The data shown in Table 1 are the average petrol consumption of sedan cars in kilometre per litre…
A: Given a data set, we have to construct stem and leaf plot of the data set.
Q: 7. Compute the crude and ständardised death rates of the two populations A and B from the following…
A:
Q: You are given the following life table: 90 91 92 93 94 95 96 97 4100 92 78 58 42 26 10 0 Based on…
A: Under uniform distribution of deaths, a=1.2|0.7q90.3a=l90.3+1.2-l90.3+1.2+0.7l90.3…
Q: Table 2. 5 shows the amount, in inches, of annual rainfall in a sample of towns. Table 2.5: Rainfall…
A: Frequency gives the number of elements in a given range for example if the range is 2-4 and elements…
Q: Table 1 displays the measurements of drying time, in hours, of a certain brand of latex paint. Table…
A: Using the given data Answer the given questions
Q: The economic dynamism, which is the index of productive growth (in dollars) for countries that are…
A: Hello! As you have posted more than 3 sub parts, we are answering the first 3 sub-parts. In case…
Q: Table 1. Survivorship table Number of deaths (D) # Of individuals who died during interval Age…
A: “Since you have posted a question with multiple sub-parts, we will solve first three sub-parts for…
Q: Use tables to express and represent the descriptive statistics for the variables below. Years…
A: Measure of central tendency and Measure of dispersion are used for the description of the data set…
Q: Population of cities and driving times are related, as shown in the accompanying table, which shows…
A: The driving time and population of 6 cities are given and a function that relates driving time with…
Q: From a cross-sectional life table provided, answer the question below: Age group Death Population…
A: Life tables are used to project future population on the basis of the present death rate.…
Q: Age Young Old All ages Population 12,000 13,000 25,000 Columbus, GA No. of deaths from Diabetes 200…
A: Age specific rate explain the measurement for various groups rate. It is calculated by dividing the…
Q: Consider the following release data for a drug in water Q (Cumulative amount released in mg/cm²)…
A: The regression equation are Q = 11.8 + 0.121×TimeQ = 0.061 + 2.96×Time
Q: In these problems we look at numerical characteristics of video cards, specifically NVidia GeForce…
A: Note: Hi there! Thank you for posting the question. As your question has more than 3 parts, we have…
Q: The following table shows the (population) frequencies of various types of patients with a…
A: Hello! As you have posted more than 3 sub parts, we are answering the first 3 sub-parts. In case…
Q: The table below shows the frequency distribution of the weights (in grams) of pre-1964 quarters. 15-…
A: To identify the correct histogram with reason
Q: Mean Shipping Cost per Unit ($) Base-Period Quantities (Year 1) Products Year 1 Year 5 A 2,500 10.50…
A:
Q: The table below shows the frequency distribution of the weights (in grams) of pre-1964 quarters. 15-…
A: Using Excel >Insert > chart, we get following histogram
Q: From the following data find out (i) purchasing power of money, (ii) real income, and (iii) real…
A:
Q: The data given below relate to the workers in an industrial town. Cost of living index for 1998 upon…
A:
Q: 16 people sign up for a weight loss class and the amount of weight lost at the end of the two-month…
A: From the given data we want to find 82 th PERCENTIL.
Q: The economic dynamism, which is the index of productive growth (in dollars) for countries that are…
A: From the provided information, Sample size (n) = 26 Level of significance (α) = 0.05
Q: Compute the crude and standardised death rates of the two populations A and B from the following…
A:
Q: The following is two years monthly sales data of 5 different outlets of a well-known textile brand.…
A: I have used Excel and the command is as follows: Data >> Data analysis >> Anova : single…
Q: Given below are the seasonal indices of sales of a firm for the year 1998 : Month Jan. | Feb. Mar.…
A:
Q: Consider the following hypothetical data showing the daily amount of rainfall for 10 weeks during…
A: a. Formula for Average is, Average rainfall=Sum of all observationsNumber of observations Average…
Q: The economic dynamism, which is the index of productive growth (in dollars) for countries that are…
A: iv) Sample mean: x-bar= 43.8727 from the excel function, =AVERAGE(J1:J26) v) Sample…
Q: The economic dynamism, which is the index of productive growth (in dollars) for countries that are…
A: Sample x (x-x̄)2 1 25.8057 326.4562376 2 41.1648 7.338681 3 49.1361 27.69180129 4 50.9866…
Q: Your investment executive claims that the average yearly rate of return on the stocks she recommends…
A:
Q: Your investment executive claims that the average yearly rate of return on the stocks she recommends…
A: The executive claims that the average yearly rate of return in the stocks she recommends is at the…
Q: Your investment executive claims that the average yearly rate of return on the stocks she recommends…
A: Hi! Thank you for the question, As per the honor code, we are allowed to answer one question at a…
Q: Write the null and alternate Hypothesis for the first two outputs. [1.5] Develop the…
A: The following table is obtained from the first two outputs Brand A = Group 1 Brand B = Group 2…
Q: Calculate Crude death rate and Age-specific death rates for the following data Age group Population…
A:
Q: Compute a 95% confidence interval for the mean economic dynamism of middle-income countries by…
A:
Q: Suppose we have the following data on the number of car crashes each month for the year 2020 in the…
A: We have to test that if number accident varies seasonally or it is constant over months for that we…
Q: Following are the quantities and prices for the years 2010 and 2018 for Kinzua Valley Geriatrics.…
A: Simple index is obtained by the formula P =PtP0×100Where Pt is the current priceP0 is base period…
Q: The economic dynamism, which is the index of productive growth (in dollars) for countries that are…
A: (iv) Obtain the t score for the 95% confidence level. The t score for the 95% confidence level…
Q: Table 1: Characteristics of Women According to Intake of Alcohol Variable Nondrinker* Drinker*…
A: Note: As per the guidelines, we are allowed to solve single question at a time when multiple…
Q: number of days a patient was hospitalized with a diagnosis of traumatic injury were recorded as…
A: From the given information, The total number of observations is, n=75. Let x denote the number of…
Q: Table 8.6 Ten Leading Causes of Morbidity in the Philippines, 1991 Rate Per 100,000 Population…
A: As this data provides the ten main leading causes of morbidity with their rate per 100,000…
Q: The prices and the numbers of various items produced by a small machine and stamping plant are…
A: Given 2010 2018 Item Price p0j Quantity q0j Price pij Quantity qij Washer 0.07 17,000…
Q: 15. Estimate the standardized death rates from the following data : Death Rate per 1000 008 Age…
A:
Q: "The following table relates to male suicide in the New Zealand, stratified by quintile of socio-…
A: Given information: Lowest SES quintile, Suicides Lowest SES quintile, Population Highest SES…
Q: 1. As quality manager of a firm producing mineral water, you are concerned with the amount of water…
A: Given: Population size=N=150,Sample size=n=5,Population standard deviation=σ=0.6,α=1-0.95=0.05.


Trending now
This is a popular solution!

Step by step
Solved in 2 steps with 2 images

- Urban Travel Times Population of cities and driving times are related, as shown in the accompanying table, which shows the 1960 population N, in thousands, for several cities, together with the average time T, in minutes, sent by residents driving to work. City Population N Driving time T Los Angeles 6489 16.8 Pittsburgh 1804 12.6 Washington 1808 14.3 Hutchinson 38 6.1 Nashville 347 10.8 Tallahassee 48 7.3 An analysis of these data, along with data from 17 other cities in the United States and Canada, led to a power model of average driving time as a function of population. a Construct a power model of driving time in minutes as a function of population measured in thousands b Is average driving time in Pittsburgh more or less than would be expected from its population? c If you wish to move to a smaller city to reduce your average driving time to work by 25, how much smaller should the city be?In general, ___________% of the values in a data set lie at or below the 28 th percentile. _______________ % of the values in a data set lie at or above the 90 th percentile.. If a sample consists of 700 test scores, _________of them would be at or below the 52 th percentile. If a sample consists of 700 test scores, ________ of them would be at or above the 64 th percentile.A researcher wishes to study the relationship between education and income separately for individuals who have college degrees, and for those who don't. To this end, he interviews 100 individuals in each category. Survey results are listed in the table below. non college graduates college graduates avg education 13 yr 18 yr std. dev. education 2 yr 1.2 yr Sxx 396 yr2 143 yr2 Avg. Income $67,200 $84,950 std. dev. income $9,400 $10,500 correlation coefficient .25 .15 a. Use the data above to find point estimates for regression coefficients B0NG and B1NG for non-college graduates and BoG and B1G for college graduates. b. Propose an unbiased estimator for the difference theta=B1G - B1NG in slope coefficients for the two sub-populations, and show that B(theta hat)= 0. c. Assume that the error terms ENG and EG for non-graduates and graduates, respectively, are both distributed normally, with known standard deviation oENG = oEG = $ 10,000. In that case, determine the…
- You may need to use the appropriate technology to answer this question. Do students with higher college grade point averages (GPAs) earn more than those graduates with lower GPAs?† Consider the following hypothetical college GPA and salary data (10 years after graduation). GPA Salary ($) 2.22 72,000 2.27 48,000 2.57 72,000 2.59 62,000 2.77 86,000 2.85 98,000 3.12 133,000 3.35 130,000 3.66 157,000 3.68 162,000 (a) Develop a scatter diagram for these data with college GPA as the independent variable. A scatter diagram has a horizontal axis labeled "GPA" with values from 2 to 4 and a vertical axis labeled "Salary ($)" with values from 0 to 180,000. The scatter diagram has 10 points. A pattern goes down and right from (2.22, 122,000) to (3.68, 8,000). The points are scattered moderately from the pattern. A scatter diagram has a horizontal axis labeled "GPA" with values from 2 to 4 and a vertical axis labeled "Salary ($)" with values from 0 to 180,000. The…The sourse table depicts the results of a fictional study investigating whether the number of hours of sleep a person gets varies with gender (male, female) and with the equal numbers of men and women were randomly assigned to drink 1, 2, or 3 cups of coffee during the course of a day and then record the number of hours they slept. Table: Coffee and Sleep Source SS df MS F Gender 0.38 1 0.38 0.33 Cups of coffee 75.38 2 37.69 32.76 Gender x cups 3.66 2 1.83 1.59 Within 34.51…A research group is interested in the relationship between exposure to mold in households after a major hurricane and the onset of acute respiratory illness in children. Suppose an observational study is conducted over 10 years following the natural disaster and the following two-by-two table was created in order to address the relationship between exposure and outcome. Acute Respiratory Illness No Acute Respiratory Illness Total Mold 378 156 534 No Mold 73 260 333 Total 451 416 867 Calculate the incidence of acute respiratory illness in the exposed and unexposed. Calculate the relative risk for ARI due to exposure in this study Interpret your findings from part B
- Toward the middle of the harvesting season, peaches for canning come in three types, early, late, and extra late, depending on the expected date of ripening. During a certain week, the data to the right were recorded at a fruit delivery station. Complete parts (a) through (d) below. 40 trucks went out carrying early peaches; 71 carried late peaches; 52 carried extra late peaches; 26 carried early and late; 32 carried late and extra late; 11 carried early and extra late; 6 carried all three; 5 carried only figs (no peaches at all). a) How many trucks carried only late variety peaches? trucks (Type a whole number.) (b) How many carried only extra late? trucks (Type a whole number.) (c) How many carried only one type of peach? trucks (Type a whole number.) (d)How many trucks (in all) went out during the week? trucks (Type a whole number.)Refer to the following infectious Hepatitis statistics for Genesee County for 2007. The population of Genesee County is 436,000 people. There were 1,050 cases of Chronic Hepatitis C at the end of 2006 The number of new cases of Chronic Hepatitis C: 355 The number of Hepatitis A cases: 32 The number of cases of acute hepatitis B: 177 Calculate the incidence rate of acute Hepatitis B for 2007._____________ Calculate the prevalence rate of chronic hepatitis C for 2007 ___________ Suppose all the hepatitis A cases were all associated with an outbreak. A food handler was ill and infected 19 people who ate at the restaurant (located in Genesee County) where the food handler was employed. Ten (10) secondary cases occurred as a result of being infected by someone who ate at the restaurant Calculate the attack rate for this…1. (Drawn from exercise 3.3 of Bodine et al) Consider the following data on the number of eastern bluebirds recorded in a survey from 1970 to 2010. Year No. of Eastern Bluebird 1970 200 1975 300 1980 125 1985 250 1990 425 1995 450 2000 575 2005 675 2010 500 a) Make a scatter plot of the number of birds vs. year record. b) Create a table with this data that compares Years Since 1900 vs. the number of birds. Fill in extra columns for Years-Since-Squared and Years*Birds. Complete the table by adding rows for column totals and column averages. c) Calculate the linear regression for this model. d) Calculate the correlation coefficient for this model. e) Translate your linear regression so that the model is now Year vs. Number of birds. f) Add the model to your scatter plot. g) Compute the residual errors for your model. h) Plot your residual errors. i) Interpolate your model to find the number of birds in 1983 and 2001.
- Toward the middle of the harvesting season, peaches for canning come in three types, early, late, and extra late, depending on the expected date of ripening. During a certain week, the data to the right were recorded at a fruit delivery station. Complete parts (a) through (d) below. 40 trucks went out carrying early peaches; 76 carried late peaches; 64 carried extra late peaches; 31 carried early and late; 34 carried late and extra late; 13 carried early and extra late; 6 carried all three; 8 carried only figs (no peaches at all). a. How many trucks carried only late variety peaches? b. How many carried only extra late? c. How many carried only one type of peach? d. How many trucks (in all) went out during the week? Thank you so muchThe owner of a chain of mini-markets wants to compare the sales performance of two of her stores, Store 1 and Store 2. Sales can vary considerably depending on the day of the week and the season of the year, so she decides to eliminate such effects by making sure to record each store's sales on the same 8 days, chosen at random. She records the sales (in dollars) for each store on these days, as shown in the table below. Day 1 2 3 4 5 6 7 8 Store 1 889 699 534 398 432 213 252 929 Store 2 479 525 252 364 160 32 234 632 Difference(Store 1 - Store 2) 410 174 282 34 272 181 18 297 Send data to calculator Based on these data, can the owner conclude, at the 0.10 level of significance, that the mean daily sales of the two stores differ? Answer this question by performing a hypothesis test regarding μd (which is μ…
