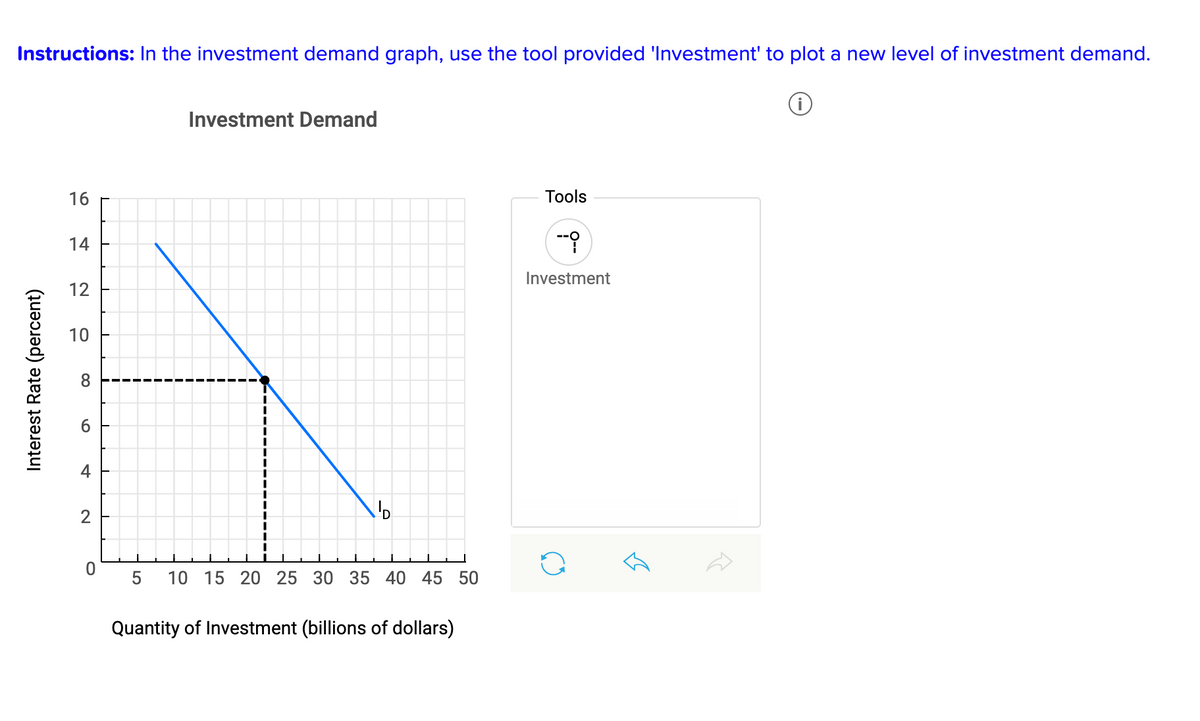
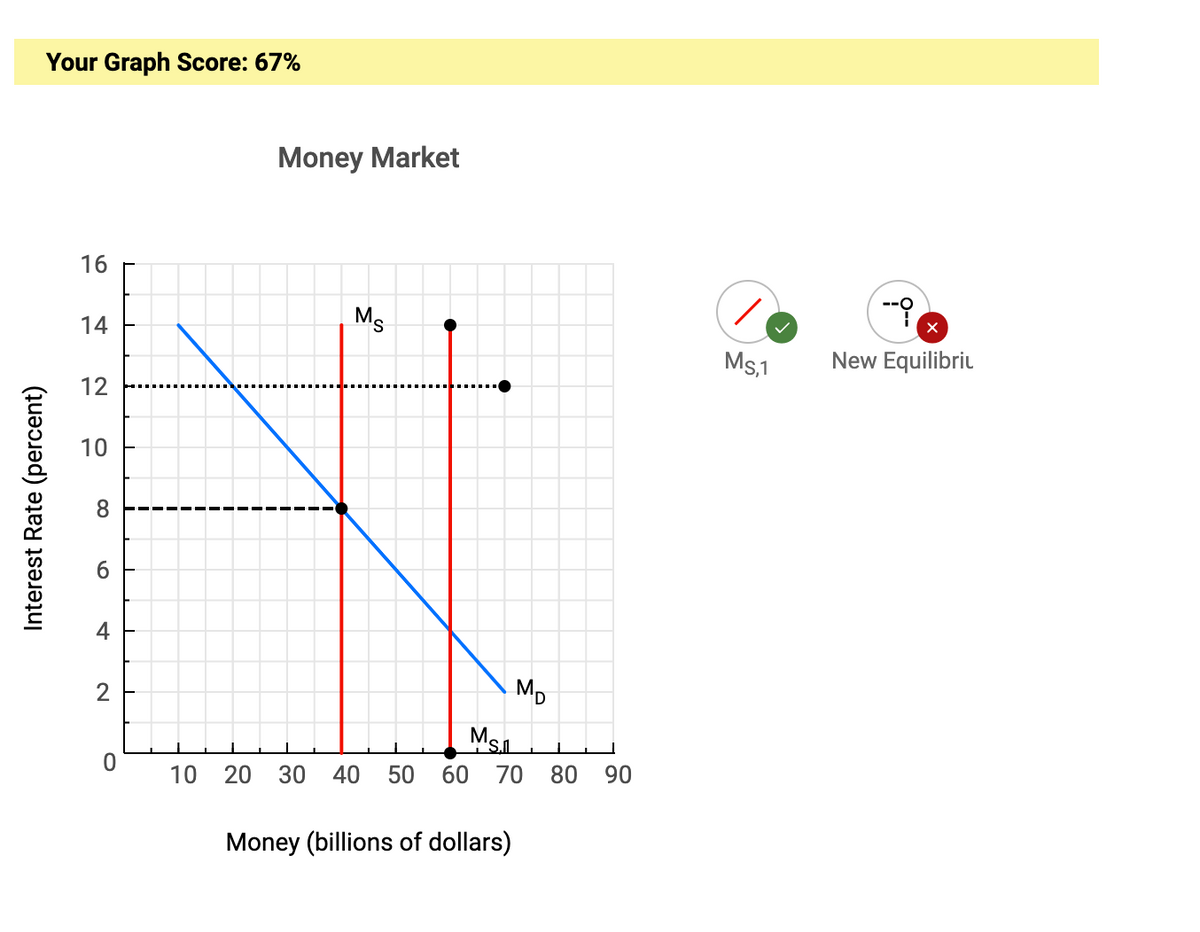
The money market in the United States and the investment demand curve are as shown in the graphs below. Currently, the Federal Reserve has a money supply of $40 billion and the money market is in equilibrium. a. Suppose the Federal Reserve increases the money supply by $20 billion. Use the money market and investment demand graphs to show the effects of the increase in the money supply on interest rates, money demand, and investment. Instructions: In the money market graph, use the tool provided 'MS,1' to draw a new money supply curve. Plot only the endpoints of the line (2 points total). Use the tool provided 'New Equilibrium' to plot a new equilibrium interest rate


The
a. Suppose the Federal Reserve increases the money supply by $20 billion. Use the money market and investment demand graphs to show the effects of the increase in the money supply on interest rates, money demand, and investment.
Instructions: In the money market graph, use the tool provided 'MS,1' to draw a new money supply curve. Plot only the endpoints of the line (2 points total). Use the tool provided 'New Equilibrium' to plot a new equilibrium interest rate.


Trending now
This is a popular solution!

Step by step
Solved in 2 steps with 1 images


