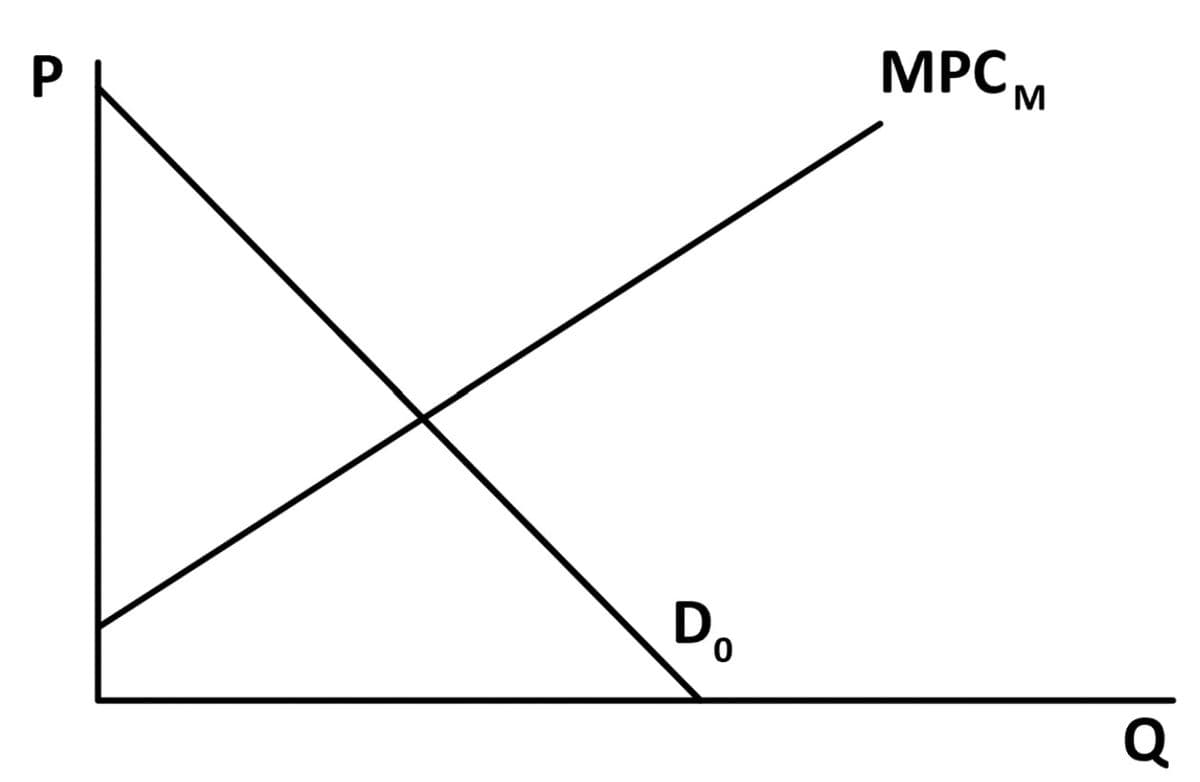
The monopolist has a linear marginal cost (shown here as Marginal Private Cost, MPCM) and a downward-sloping demand curve D0. Here is a graphical representation of that market. See attached image for graph. 1) As noted in the introduction for Questions 1 through 5, the market is served by a monopolist. Assume that this monopolist is making a positive economic profit. Add any necessary curve(s) to the graph shown above and graphically indicate: The original monopoly price P0 and monopoly quantity Q0. The “socially optimal” output (the output the Benevolent Dictator would choose) QSO. The resulting Consumer Surplus CS0, the resulting Producer Surplus PS0, and the size of Dead-Weight Loss DWL0 if there is such a loss. Positive economic profits π0. (Note that here we asking you to graphically depict the total profits earned by the monopolist and not just the profits earned per unit sold. You may have to add an additional curve in order to graphically show economic profits on this graph.) 2) As it relates to your graph from Question 1, please explain in a narrative response of:


There are 5 subparts to this Questionn. please consider a market served by a monopolist. The monopolist has a linear marginal cost (shown here as Marginal Private Cost, MPCM) and a downward-sloping demand curve D0. Here is a graphical representation of that market. See attached image for graph.
1) As noted in the introduction for Questions 1 through 5, the market is served by a monopolist. Assume that this monopolist is making a positive economic profit.
Add any necessary curve(s) to the graph shown above and graphically indicate:
- The original
monopoly price P0 and monopoly quantity Q0. - The “socially optimal” output (the output the Benevolent Dictator would choose) QSO.
- The resulting Consumer Surplus CS0, the resulting
Producer Surplus PS0, and the size of Dead-Weight Loss DWL0 if there is such a loss. - Positive economic profits π0. (Note that here we asking you to graphically depict the total profits earned by the monopolist and not just the profits earned per unit sold. You may have to add an additional curve in order to graphically show economic profits on this graph.)
2) As it relates to your graph from Question 1, please explain in a narrative response of:
- How you determined the monopolist output level Q0 and price P0, the socially optimal output level QSO, and the presence (or absence) of dead-weight loss DWL0 in this situation. Please incorporate in your explanation a statement explaining which, if any, cost or revenue curves you had to add to the graph to make this determination and why; and make sure that you explain whether the monopolist produces more, less, or exactly the same as the socially optimally output.
- How you determined the size of the monopoly profits and why your graphical depiction of profits represents the total economic profits π0 earned by the monopolist. Please incorporate in your explanation a statement explaining which, if any, cost or revenue curves you had to add to the graph to make this determination and why.
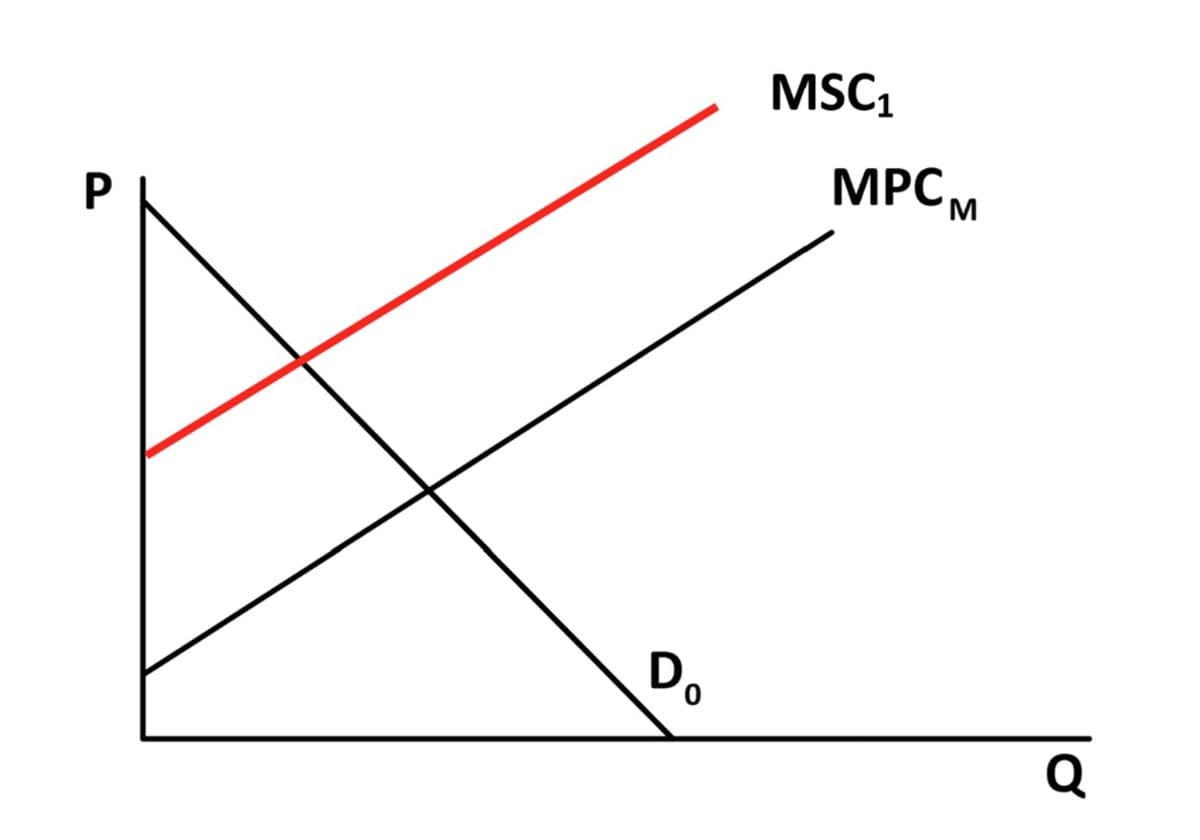
3) Now suppose that this product has a significant negative externality. As a result of the negative externality, for every given output level Marginal
Please indicate on the graph above, assuming an absence of any government intervention to correct the negative externality and adding any necessary curve(s):
- The monopoly price P1 and the monopoly quantity Q1 under the condition of the (uncorrected) negative externality. (Also indicate, for comparison purposes, the original monopoly price P0 and monopoly quantity Q0.)
- The Socially Optimal output, QSO1.
- The resulting Consumer Surplus CS1, the resulting Producer Surplus PS1, and the size of Dead-Weight Loss DWL1 if there is such a loss.
- (No need to show the economic profits earned by the monopolist and/or to add any curves necessary to graphically show such profits).
4) As it relates to your graph from Question 3, please explain in a narrative response of approximately two paragraphs (total):
- How you determined the monopolist output level Q1 and price P1 when a negative externality was present. How do they compare to Q0 and price P0 you found in Questions 1 and 2 in the absence of a negative externality (smaller, larger, the same) and why?
- How you determined the socially optimal output level QSO1 when a negative externality was present. How does QSO1 compare to the QSO you found in Questions 1 and 2 in the absence of a negative externality (smaller, larger, the same) and why? How does QSO1 compare to the Q1 (monopolist’s output) you found in Questions 3 and 4 (smaller, larger, the same) and why?
5) In this question, you will discuss the general case of negative externalities and an interesting outcome of a monopolist’s presence in a market with a negative externality.
- In the case that you’ve illustrated in Questions 1 and 2, what was the impact of a monopolist’s presence on a market without negative externalities? Did the monopolist hurt the overall social gain (i.e., total surplus or total welfare)? Please explain. (Suggested length: One paragraph).
- In the case that you’ve illustrated in Questions 3 and 4, what was the impact of a monopolist’s presence on a market with negative externalities? Could a
monopolist improve the competitive market outcome for a good or a service with negative externalities (and no government intervention to correct it)? Why or why not? Please explain. (Suggested length: One to two paragraphs).

Step by step
Solved in 3 steps with 2 images


