The national distribution of fatal work injuries in a country is shown in the table to the right under National %. You believe that the distribution of fatal work injuries is different in the western part of the country and randomly select 6231 fatal work injuries occurring in that region. At a= 0.05 National % 42% Cause Western Frequency Transportation can you conclude that the distribution of fatal work injuries in the west is different from the national distribution? Complete parts a through d below. Equipment Assaults Falls Harmful fumes Fires 2893 19% 1157 14% 806 13% 753 10% 532 2% 90 a. State H, and H, and identify the claim. What is the null hypothesis, Ho? O A. The distribution of fatal work injuries in the west is 42% transportation, 19% equipment, 14% assaults, 13% falls, 10% harmful fumes, and 2% fires. O B. The distribution of fatal work injuries in the west differs from the expected distribution. O C. The distribution of fatal work injuries in the west is 2893 transportation, 1157 equipment, 806 assaults, 753 falls, 532 harmful fumes, and 90 fires. What is the alternate hypothesis, H,? O A. The distribution of fatal work injuries in the west is 42% transportation, 19% equipment, 14% assaults, 13% falls, 10% harmful fumes, and 2% fires. O B. The distribution of fatal work injuries in the west is the same as the expected distribution. O C. The distribution of fatal work injuries in the west differs from the expected distribution. Which hypothesis is the claim? O Ho O H.
The national distribution of fatal work injuries in a country is shown in the table to the right under National %. You believe that the distribution of fatal work injuries is different in the western part of the country and randomly select 6231 fatal work injuries occurring in that region. At a= 0.05 National % 42% Cause Western Frequency Transportation can you conclude that the distribution of fatal work injuries in the west is different from the national distribution? Complete parts a through d below. Equipment Assaults Falls Harmful fumes Fires 2893 19% 1157 14% 806 13% 753 10% 532 2% 90 a. State H, and H, and identify the claim. What is the null hypothesis, Ho? O A. The distribution of fatal work injuries in the west is 42% transportation, 19% equipment, 14% assaults, 13% falls, 10% harmful fumes, and 2% fires. O B. The distribution of fatal work injuries in the west differs from the expected distribution. O C. The distribution of fatal work injuries in the west is 2893 transportation, 1157 equipment, 806 assaults, 753 falls, 532 harmful fumes, and 90 fires. What is the alternate hypothesis, H,? O A. The distribution of fatal work injuries in the west is 42% transportation, 19% equipment, 14% assaults, 13% falls, 10% harmful fumes, and 2% fires. O B. The distribution of fatal work injuries in the west is the same as the expected distribution. O C. The distribution of fatal work injuries in the west differs from the expected distribution. Which hypothesis is the claim? O Ho O H.

Glencoe Algebra 1, Student Edition, 9780079039897, 0079039898, 2018
18th Edition
ISBN:9780079039897
Author:Carter
Publisher:Carter
Chapter10: Statistics
Section10.6: Summarizing Categorical Data
Problem 4BGP

Related questions

Concept explainers
Contingency Table
A contingency table can be defined as the visual representation of the relationship between two or more categorical variables that can be evaluated and registered. It is a categorical version of the scatterplot, which is used to investigate the linear relationship between two variables. A contingency table is indeed a type of frequency distribution table that displays two variables at the same time.
Binomial Distribution
Binomial is an algebraic expression of the sum or the difference of two terms. Before knowing about binomial distribution, we must know about the binomial theorem.
Topic Video
Question
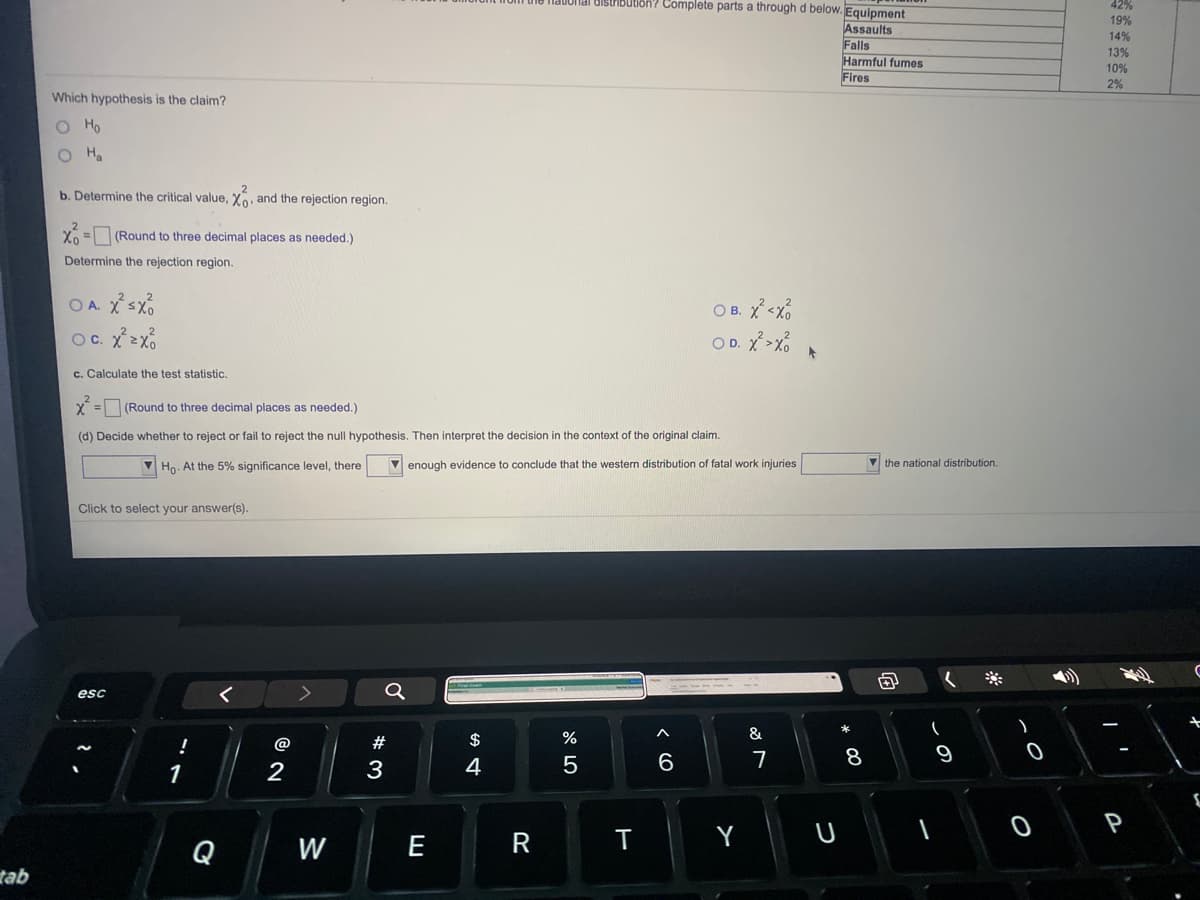
Transcribed Image Text:UiSCIButiSh? Complete parts a through d below. Equipment
19%
Assaults
Falls
Harmful fumes
Fires
14%
13%
10%
2%
Which hypothesis is the claim?
Ho
O Ha
b. Determine the critical value, Xo, and the rejection region.
XA = (Round to three decimal places as needed.)
Determine the rejection region.
O A. Xsx
OD. >%
O C.
c. Calculate the test statistic.
X = (Round to three decimal places as needed.)
(d) Decide whether to reject or fail to reject the null hypothesis. Then interpret the decision in the context of the original claim.
V Ho. At the 5% significance level, there
fatal work injuries
V the natic
V enough evidence to conclude that the western distribution
istribution.
Click to select your answer(s).
esc
&
!
@
#
$
2
3
4
5
7
8
1
P
Q
W
E
R
tab
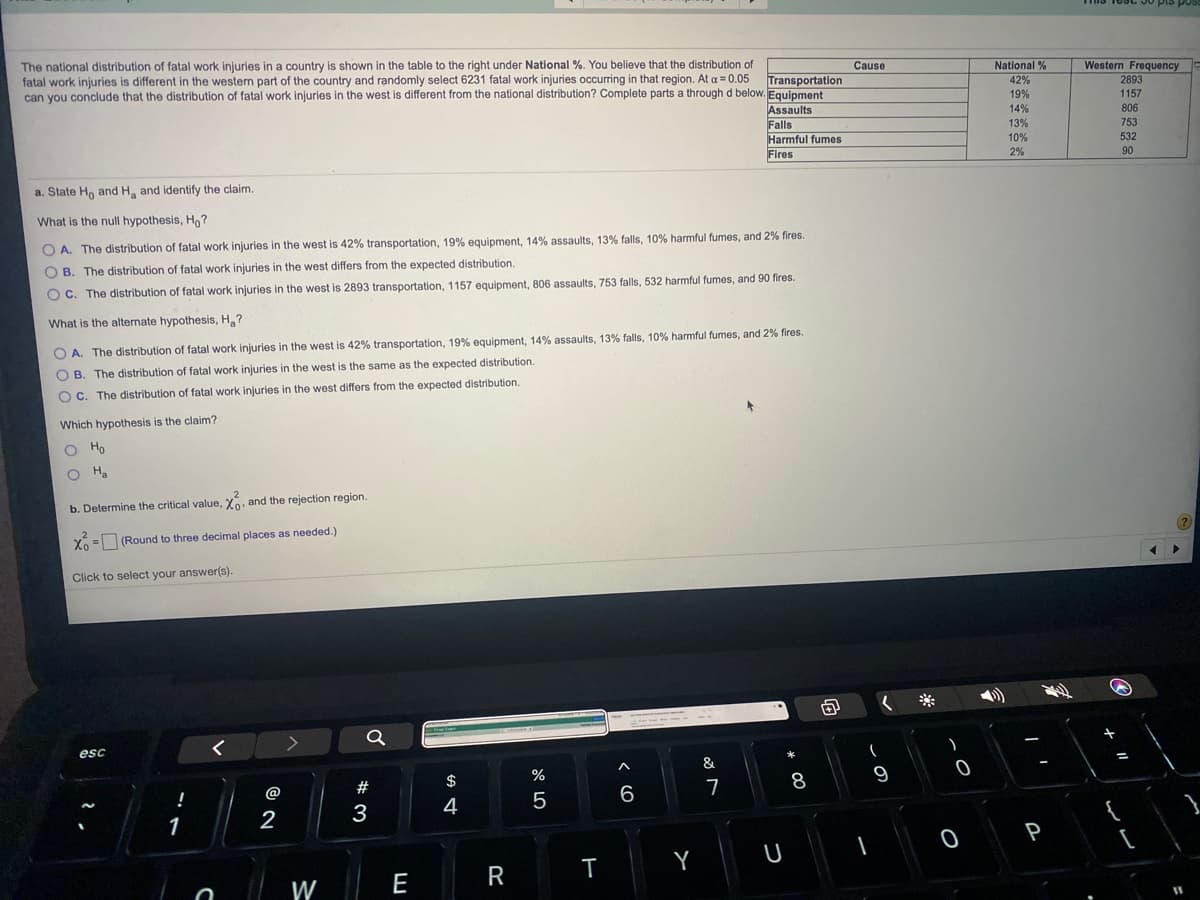
Transcribed Image Text:The national distribution of fatal work injuries in a country is shown in the table to the right under National %. You believe that the distribution of
fatal work injuries is different in the western part of the country and randomly select 6231 fatal work injuries occurring in that region. At a = 0.05
National %
42%
Western Frequency
2893
Cause
Transportation
can you conclude that the distribution of fatal work injuries in the west is different from the national distribution? Complete parts a through d below. Equipment
Assaults
Falls
Harmful fumes
19%
1157
14%
806
13%
753
10%
532
Fires
2%
90
a. State Ho and H and identify the claim.
What is the null hypothesis, Ho?
O A. The distribution of fatal work injuries in the west is 42% transportation, 19% equipment, 14% assaults, 13% falls, 10% harmful fumes, and 2% fires
O B. The distribution of fatal work injuries in the west differs from the expected distribution.
O C. The distribution of fatal work injuries in the west is 2893 transportation, 1157 equipment, 806 assaults, 753 falls, 532 harmful fumes, and 90 fires.
What is the alternate hypothesis, H,?
O A. The distribution of fatal work injuries in the west is 42% transportation, 19% equipment, 14% assaults, 13% falls, 10% harmful fumes, and 2% fires.
O B. The distribution of fatal work injuries in the west is the same as the expected distribution.
O C. The distribution of fatal work injuries in the west differs from the expected distribution.
Which hypothesis is the claim?
O Ho
O Ha
b. Determine the critical value, Xo, and the rejection region.
X = (Round to three decimal places as needed.)
Click to select your answer(s).
esc
&
%
#
$
7
8
!
@
5
6.
3
4
1
2
P
Y
E
R
W
Expert Solution
This question has been solved!
Explore an expertly crafted, step-by-step solution for a thorough understanding of key concepts.

This is a popular solution!

Trending now
This is a popular solution!

Step by step
Solved in 4 steps with 1 images

Knowledge Booster


Learn more about
Need a deep-dive on the concept behind this application? Look no further. Learn more about this topic, statistics and related others by exploring similar questions and additional content below.Recommended textbooks for you
Glencoe Algebra 1, Student Edition, 9780079039897…
Algebra
ISBN:
9780079039897
Author:
Carter
Publisher:
McGraw Hill
Glencoe Algebra 1, Student Edition, 9780079039897…
Algebra
ISBN:
9780079039897
Author:
Carter
Publisher:
McGraw Hill