The nine measurements that follow are furnace temperatures recorded on successive batches in a semiconductor manufacturing process (units are in °F): 953, 950, 948, 955, 951, 949, 957, 954, 955. The box plot is also shown. Which among the choices gives the most correct results of the data presented in the box plot? Boxplot of Temperature 957 956 955 954 953 952 951 950 949 948 Oa. Computed mean is 952.44. The measurements show large dispersion. O b. Upper and lower outier bounderies are the largest and smallest measurement respectively Oc. Most measurements are within Q1 (1st quartile) and the median Oa. Mean value is close to the median. An increase in the largest temperature measurement does not affect the median Temperature
The nine measurements that follow are furnace temperatures recorded on successive batches in a semiconductor manufacturing process (units are in °F): 953, 950, 948, 955, 951, 949, 957, 954, 955. The box plot is also shown. Which among the choices gives the most correct results of the data presented in the box plot? Boxplot of Temperature 957 956 955 954 953 952 951 950 949 948 Oa. Computed mean is 952.44. The measurements show large dispersion. O b. Upper and lower outier bounderies are the largest and smallest measurement respectively Oc. Most measurements are within Q1 (1st quartile) and the median Oa. Mean value is close to the median. An increase in the largest temperature measurement does not affect the median Temperature

Big Ideas Math A Bridge To Success Algebra 1: Student Edition 2015
1st Edition
ISBN:9781680331141
Author:HOUGHTON MIFFLIN HARCOURT
Publisher:HOUGHTON MIFFLIN HARCOURT
Chapter11: Data Analysis And Displays
Section: Chapter Questions
Problem 11CR

Related questions
Question
please answer last 8 mins. Thank you!
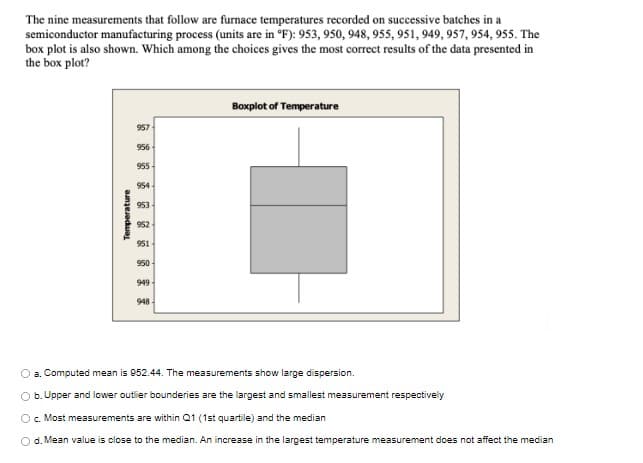
Transcribed Image Text:The nine measurements that follow are furnace temperatures recorded on successive batches in a
semiconductor manufacturing process (units are in °F): 953, 950, 948, 955, 951, 949, 957, 954, 955. The
box plot is also shown. Which among the choices gives the most correct results of the data presented in
the box plot?
Boxplot of Temperature
957
956
955
954
953
952
951
950
949
948
O a. Computed mean is 952.44. The measurements show large dispersion.
O b. Upper and lower outlier bounderies are the largest and smallest measurement respectively
O. Most measurements are within Q1 (1st quartile) and the median
Od. Mean value is close to the median. An increase in the largest temperature measurement does not affect the median
Temperature
Expert Solution
This question has been solved!
Explore an expertly crafted, step-by-step solution for a thorough understanding of key concepts.

Step by step
Solved in 4 steps

Recommended textbooks for you
Big Ideas Math A Bridge To Success Algebra 1: Stu…
Algebra
ISBN:
9781680331141
Author:
HOUGHTON MIFFLIN HARCOURT
Publisher:
Houghton Mifflin Harcourt

Glencoe Algebra 1, Student Edition, 9780079039897…
Algebra
ISBN:
9780079039897
Author:
Carter
Publisher:
McGraw Hill

Holt Mcdougal Larson Pre-algebra: Student Edition…
Algebra
ISBN:
9780547587776
Author:
HOLT MCDOUGAL
Publisher:
HOLT MCDOUGAL
Big Ideas Math A Bridge To Success Algebra 1: Stu…
Algebra
ISBN:
9781680331141
Author:
HOUGHTON MIFFLIN HARCOURT
Publisher:
Houghton Mifflin Harcourt
Glencoe Algebra 1, Student Edition, 9780079039897…
Algebra
ISBN:
9780079039897
Author:
Carter
Publisher:
McGraw Hill
Holt Mcdougal Larson Pre-algebra: Student Edition…
Algebra
ISBN:
9780547587776
Author:
HOLT MCDOUGAL
Publisher:
HOLT MCDOUGAL