The Normal Distribution Activity For Data Set 1 Мean 8.70 Variance= 4.6423 Standard Deviation = 2.1546 1. Sketch the first bell curve by showing the mean and standard deviation. 2. What is the data value (raw score) associated with a standard score of 1.1? Determine the percentage less than this score. Draw the curve and show your complete solution. u atu er The percentage that is less than the raw score of 11.0701 hours is 84.38%. 3. What is the data value (raw score) associated with a standard score of -0.09? Determine the percentage greater than this score. Draw the curve and show your complete solution. -1.0 .1. ceee aN Ru The percentage that is greater than the raw score of 8.5061 hours is 81.59%.
The Normal Distribution Activity For Data Set 1 Мean 8.70 Variance= 4.6423 Standard Deviation = 2.1546 1. Sketch the first bell curve by showing the mean and standard deviation. 2. What is the data value (raw score) associated with a standard score of 1.1? Determine the percentage less than this score. Draw the curve and show your complete solution. u atu er The percentage that is less than the raw score of 11.0701 hours is 84.38%. 3. What is the data value (raw score) associated with a standard score of -0.09? Determine the percentage greater than this score. Draw the curve and show your complete solution. -1.0 .1. ceee aN Ru The percentage that is greater than the raw score of 8.5061 hours is 81.59%.

Glencoe Algebra 1, Student Edition, 9780079039897, 0079039898, 2018
18th Edition
ISBN:9780079039897
Author:Carter
Publisher:Carter
Chapter10: Statistics
Section: Chapter Questions
Problem 25SGR

Related questions
Question
answer 1 2 3 HANDWRITTEN
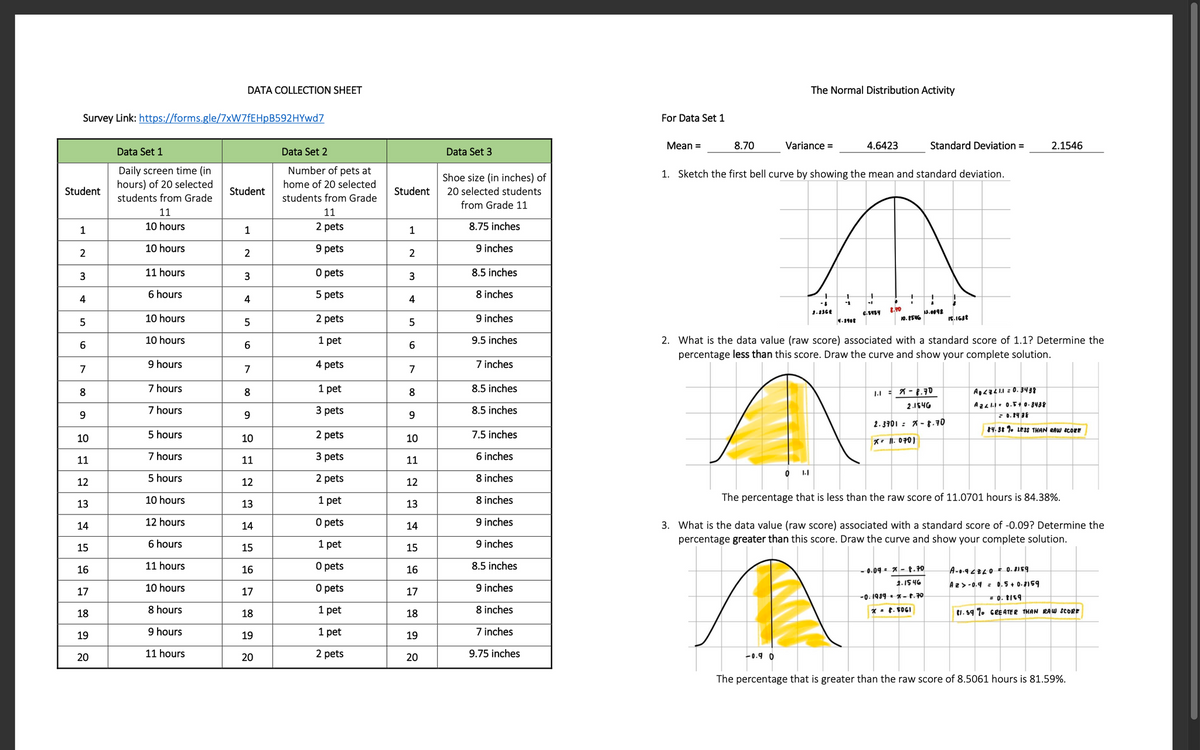
Transcribed Image Text:DATA COLLECTION SHEET
The Normal Distribution Activity
Survey Link: https://forms.gle/7xW7fEHpB592HYwd7
For Data Set 1
Мean %3D
8.70
Variance =
4.6423
Standard Deviation =
2.1546
Data Set 1
Data Set 2
Data Set 3
Number of pets at
Daily screen time (in
hours) of 20 selected
students from Grade
Shoe size (in inches) of
1. Sketch the first bell curve by showing the mean and standard deviation.
home of 20 selected
Student
Student
Student
20 selected students
students from Grade
from Grade 11
11
11
1
10 hours
1
2 pets
1
8.75 inches
2
10 hours
2
9 pets
2
9 inches
3
11 hours
O pets
8.5 inches
6 hours
4
5 pets
4
8 inches
1.136e
10 hours
2 pets
9 inches
10. ISG
10 hours
1 pet
9.5 inches
2. What is the data value (raw score) associated with a standard score of 1.1? Determine the
percentage less than this score. Draw the curve and show your complete solution.
9 hours
4 pets
7 inches
7
7
7
8
7 hours
8
1 pet
8
8.5 inches
I.I = X - 8.7o
A24 1.. 0.5+ 0. 3438
: 0. 14 38
2.154G
7 hours
3 pets
8.5 inches
9
9
9
2.3701 : X- 8.0
84. 38 9. Less THAN RAW SCOEE
10
5 hours
10
2 pets
10
7.5 inches
X- I. 070)
11
7 hours
11
3 pets
11
6 inches
0 11
12
5 hours
12
2 pets
12
8 inches
13
10 hours
13
1 pet
13
8 inches
The percentage that is less than the raw score of 11.0701 hours is 84.38%.
14
12 hours
14
O pets
14
9 inches
3. What is the data value (raw score) associated with a standard score of -0.09? Determine the
6 hours
1 pet
percentage greater than this score. Draw the curve and show your complete solution.
9 inches
15
15
15
11 hours
O pets
8.5 inches
- 0.09 X- 8. 40
2.15 46
16
16
16
Az>-0.4 : 0.5 + 0.159
17
10 hours
17
O pets
17
9 inches
-0. 1999 . x-r.70
18
8 hours
18
1 pet
18
8 inches
X- 8. SOGI
el. s9 %% ceE ATE R THAN RAw SCORE
19
9 hours
19
1 pet
19
7 inches
20
11 hours
20
2 pets
20
9.75 inches
-0.9 0
The percentage that is greater than the raw score of 8.5061 hours is 81.59%.
Expert Solution
This question has been solved!
Explore an expertly crafted, step-by-step solution for a thorough understanding of key concepts.

This is a popular solution!

Trending now
This is a popular solution!

Step by step
Solved in 4 steps with 4 images

Recommended textbooks for you
Glencoe Algebra 1, Student Edition, 9780079039897…
Algebra
ISBN:
9780079039897
Author:
Carter
Publisher:
McGraw Hill
Glencoe Algebra 1, Student Edition, 9780079039897…
Algebra
ISBN:
9780079039897
Author:
Carter
Publisher:
McGraw Hill