The numbers of courses taught per semester by a random sample of university professors are shown in the histogram. Make a frequency distribution for the data. Then use the table to estimate the sample mean and the sample standard deviation of the data set 25 22 20 20- 15 15 10 5- Number of courses taught per semester Make a frequency distribution for the data X. 1. 2 3 4. The sample mean is x= (Round to one decimal place as needed.) The sample standard deviation is s= (Round to one decimal place as needed.) Number of protmson
The numbers of courses taught per semester by a random sample of university professors are shown in the histogram. Make a frequency distribution for the data. Then use the table to estimate the sample mean and the sample standard deviation of the data set 25 22 20 20- 15 15 10 5- Number of courses taught per semester Make a frequency distribution for the data X. 1. 2 3 4. The sample mean is x= (Round to one decimal place as needed.) The sample standard deviation is s= (Round to one decimal place as needed.) Number of protmson

Glencoe Algebra 1, Student Edition, 9780079039897, 0079039898, 2018
18th Edition
ISBN:9780079039897
Author:Carter
Publisher:Carter
Chapter10: Statistics
Section10.3: Measures Of Spread
Problem 26PFA

Related questions
Question
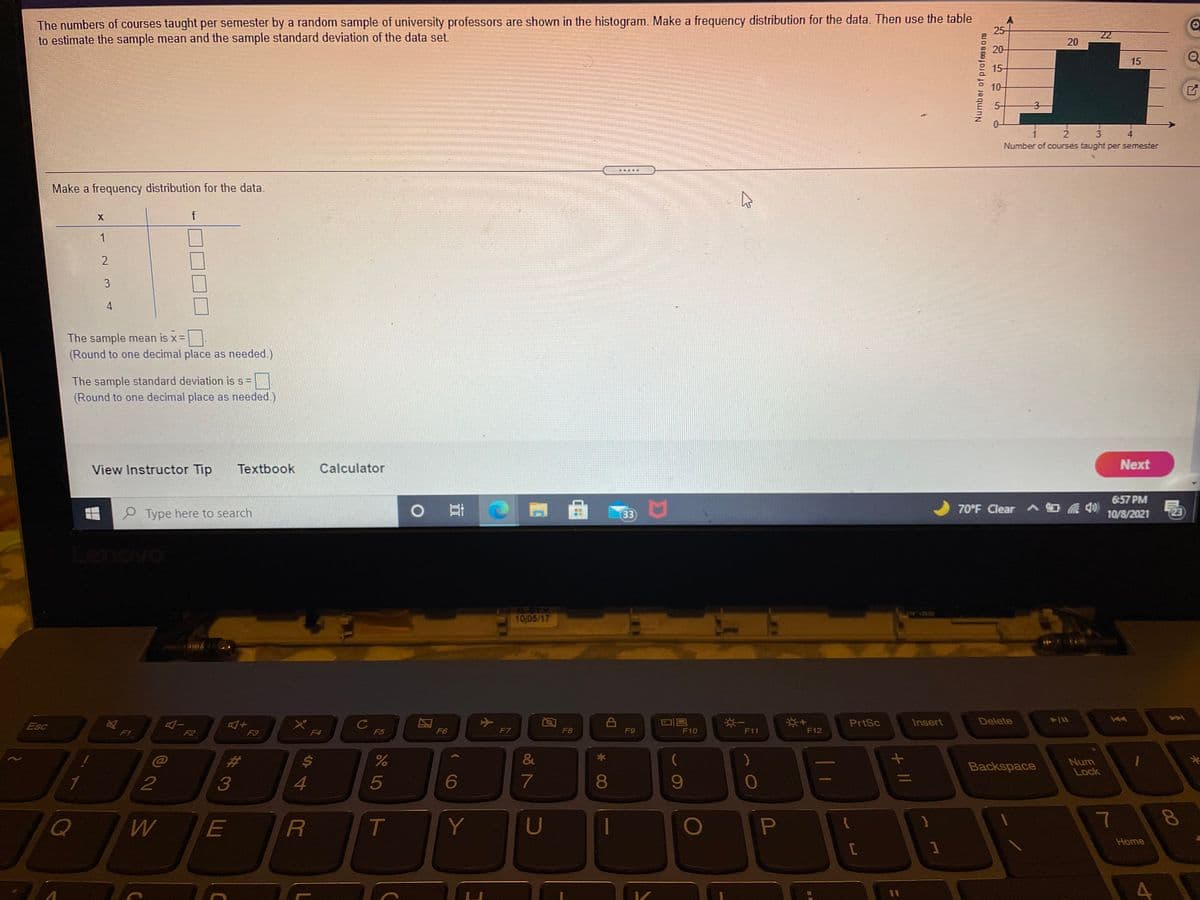
Transcribed Image Text:The numbers of courses taught per semester by a random sample of university professors are shown in the histogram. Make a frequency distribution for the data. Then use the table
to estimate the sample mean and the sample standard deviation of the data set.
25-
22
20
20-
15
15-
10-
5-
2
Number of courses taught per semester
Make a frequency distribution for the data.
2
3.
4
The sample mean is x=.
(Round to one decimal place as needed.)
The sample standard deviation is s =
(Round to one decimal place as needed.)
View Instructor Tip
Textbook
Calculator
Next
6:57 PM
P Type here to search
33
70°F Clear A O 40
23
10/8/2021
nd
10/05/17
Esc
PrtSc
Insert
Delete
F1
F7
F2
F3
F4
F5
F6
F8
F9
F10
F11
F12
@
%23
&
Num
Lock
Backspace
2
3
5
6
7
8
E
T.
Y
U
P
Home
Number of professora
+II
小
%24
Expert Solution
This question has been solved!
Explore an expertly crafted, step-by-step solution for a thorough understanding of key concepts.

This is a popular solution!

Trending now
This is a popular solution!

Step by step
Solved in 2 steps with 2 images

Recommended textbooks for you
Glencoe Algebra 1, Student Edition, 9780079039897…
Algebra
ISBN:
9780079039897
Author:
Carter
Publisher:
McGraw Hill
Glencoe Algebra 1, Student Edition, 9780079039897…
Algebra
ISBN:
9780079039897
Author:
Carter
Publisher:
McGraw Hill