The nutritionist wants to study whether the mean change in triglyceride level of the clients differs among the three meat diets. She then asked your statistical advice considering that you have enough knowledge that using a parametric test specifically the F-test in Analysis of Variance (ANOVA) can answer her objective. Using R Commander, the following results for the test of the assumptions were generated. a COMMLANDED QUTDLIT
The nutritionist wants to study whether the mean change in triglyceride level of the clients differs among the three meat diets. She then asked your statistical advice considering that you have enough knowledge that using a parametric test specifically the F-test in Analysis of Variance (ANOVA) can answer her objective. Using R Commander, the following results for the test of the assumptions were generated. a COMMLANDED QUTDLIT

MATLAB: An Introduction with Applications
6th Edition
ISBN:9781119256830
Author:Amos Gilat
Publisher:Amos Gilat
Chapter1: Starting With Matlab
Section: Chapter Questions
Problem 1P

Related questions
Question
100%
Answer the following:
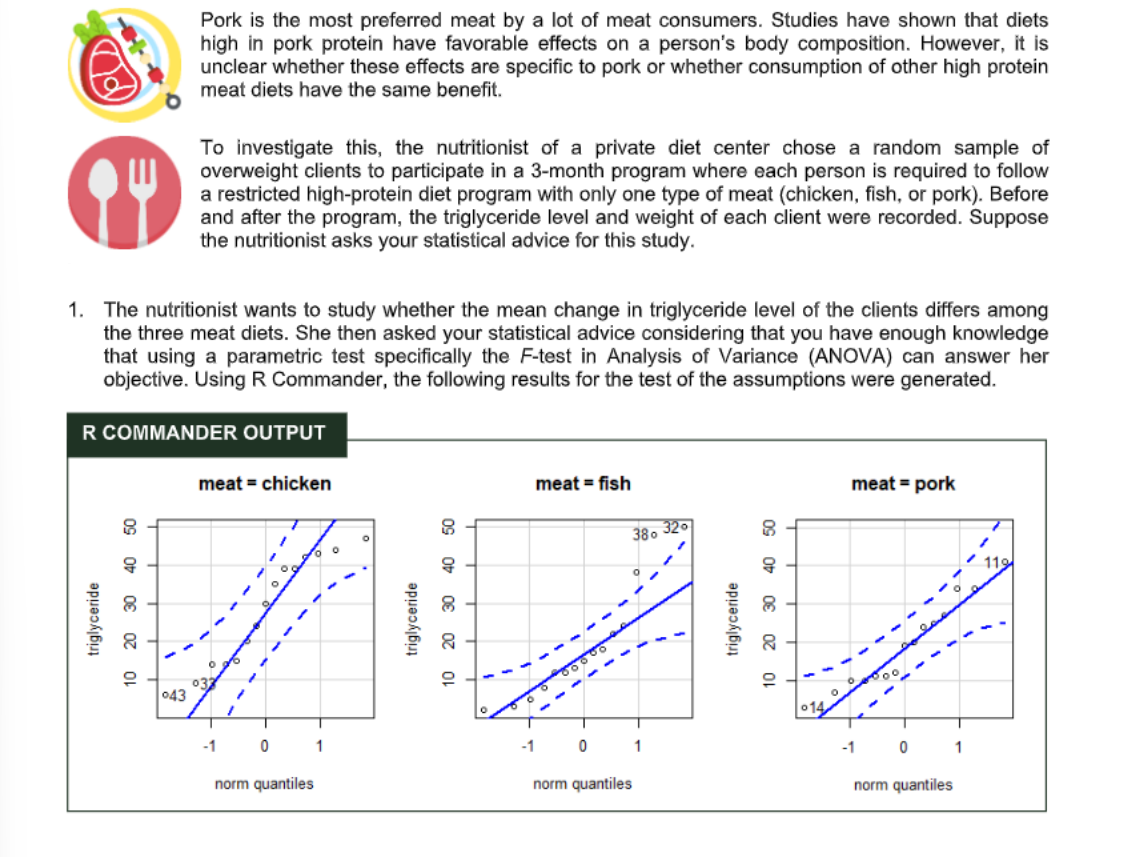
Transcribed Image Text:Pork is the most preferred meat by a lot of meat consumers. Studies have shown that diets
high in pork protein have favorable effects on a person's body composition. However, it is
unclear whether these effects are specific to pork or whether consumption of other high protein
meat diets have the same benefit.
To investigate this, the nutritionist of a private diet center chose a random sample of
overweight clients to participate in a 3-month program where each person is required to follow
a restricted high-protein diet program with only one type of meat (chicken, fish, or pork). Before
and after the program, the triglyceride level and weight of each client were recorded. Suppose
the nutritionist asks your statistical advice for this study.
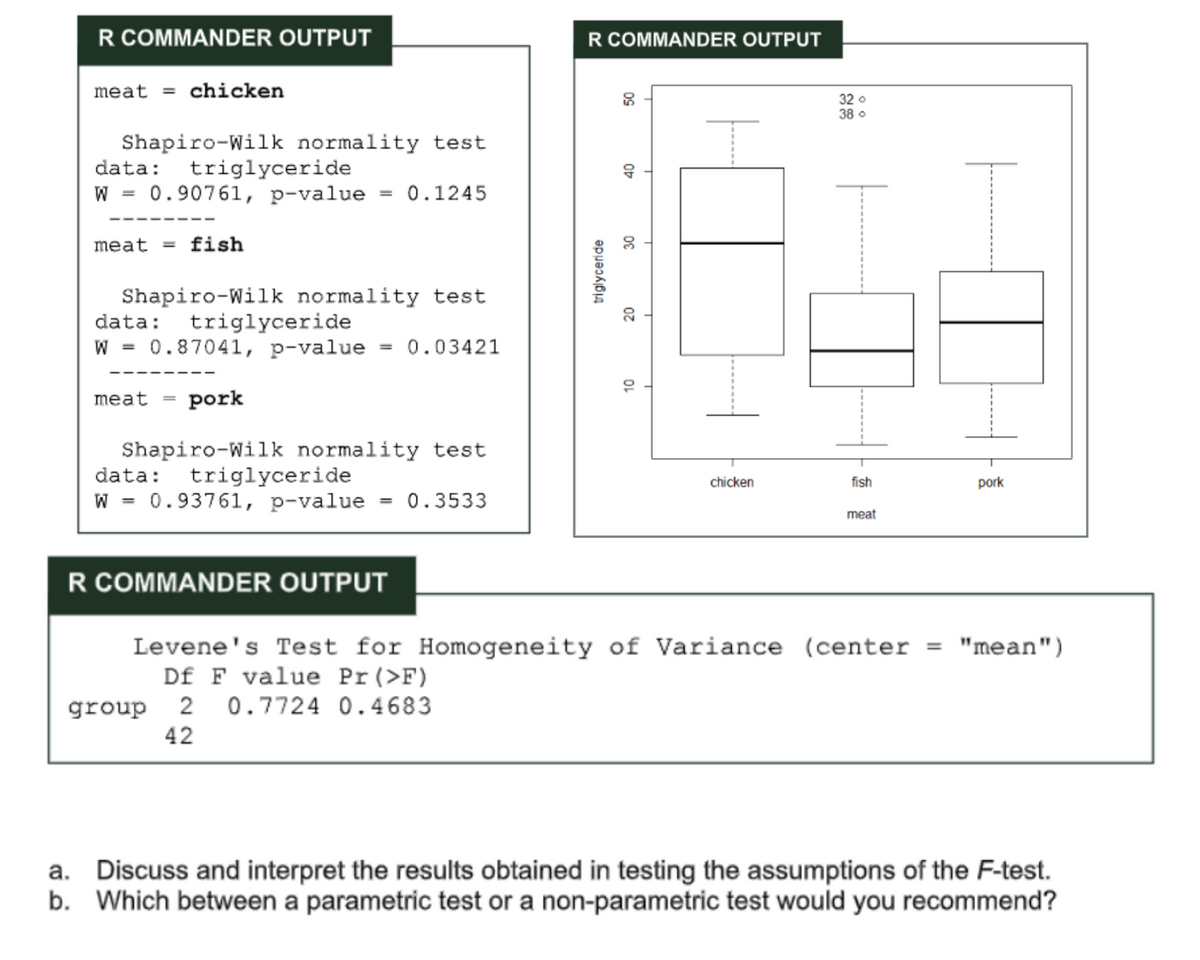
1. The nutritionist wants to study whether the mean change in triglyceride level of the clients differs among
the three meat diets. She then asked your statistical advice considering that you have enough knowledge
that using a parametric test specifically the F-test in Analysis of Variance (ANOVA) can answer her
objective. Using R Commander, the following results for the test of the assumptions were generated.
R COMMANDER OUTPUT
meat = chicken
meat = fish
meat = pork
38. 320
032
043
-- --
-1
1
-1
-1
1
norm quantiles
norm quantiles
norm quantiles
triglyceride
10 20 30 40 50
triglyceride
10 20 30 40 50
triglyceride
10 20
40 50
Transcribed Image Text:R COMMANDER OUTPUT
R COMMANDER OUTPUT
meat = chicken
32 o
38 o
Shapiro-Wilk normality test
data: triglyceride
W = 0.90761, p-value = 0.1245
%3D
%3D
meat
fish
Shapiro-Wilk normality test
data: triglyceride
W = 0.87041, p-value = 0.03421
----
meat = pork
Shapiro-Wilk normality test
data: triglyceride
W = 0.93761, p-value
chicken
fish
pork
0.3533
%3D
meat
R COMMANDER OUTPUT
Levene's Test for Homogeneity of Variance (center = "mean")
Df F value Pr(>F)
2 0.7724 0.4683
group
42
Discuss and interpret the results obtained in testing the assumptions of the F-test.
b. Which between a parametric test or a non-parametric test would you recommend?
triglyceride
OS
Expert Solution
This question has been solved!
Explore an expertly crafted, step-by-step solution for a thorough understanding of key concepts.

This is a popular solution!

Trending now
This is a popular solution!

Step by step
Solved in 2 steps

Recommended textbooks for you
MATLAB: An Introduction with Applications
Statistics
ISBN:
9781119256830
Author:
Amos Gilat
Publisher:
John Wiley & Sons Inc

Probability and Statistics for Engineering and th…
Statistics
ISBN:
9781305251809
Author:
Jay L. Devore
Publisher:
Cengage Learning

Statistics for The Behavioral Sciences (MindTap C…
Statistics
ISBN:
9781305504912
Author:
Frederick J Gravetter, Larry B. Wallnau
Publisher:
Cengage Learning
MATLAB: An Introduction with Applications
Statistics
ISBN:
9781119256830
Author:
Amos Gilat
Publisher:
John Wiley & Sons Inc
Probability and Statistics for Engineering and th…
Statistics
ISBN:
9781305251809
Author:
Jay L. Devore
Publisher:
Cengage Learning
Statistics for The Behavioral Sciences (MindTap C…
Statistics
ISBN:
9781305504912
Author:
Frederick J Gravetter, Larry B. Wallnau
Publisher:
Cengage Learning

Elementary Statistics: Picturing the World (7th E…
Statistics
ISBN:
9780134683416
Author:
Ron Larson, Betsy Farber
Publisher:
PEARSON

The Basic Practice of Statistics
Statistics
ISBN:
9781319042578
Author:
David S. Moore, William I. Notz, Michael A. Fligner
Publisher:
W. H. Freeman

Introduction to the Practice of Statistics
Statistics
ISBN:
9781319013387
Author:
David S. Moore, George P. McCabe, Bruce A. Craig
Publisher:
W. H. Freeman