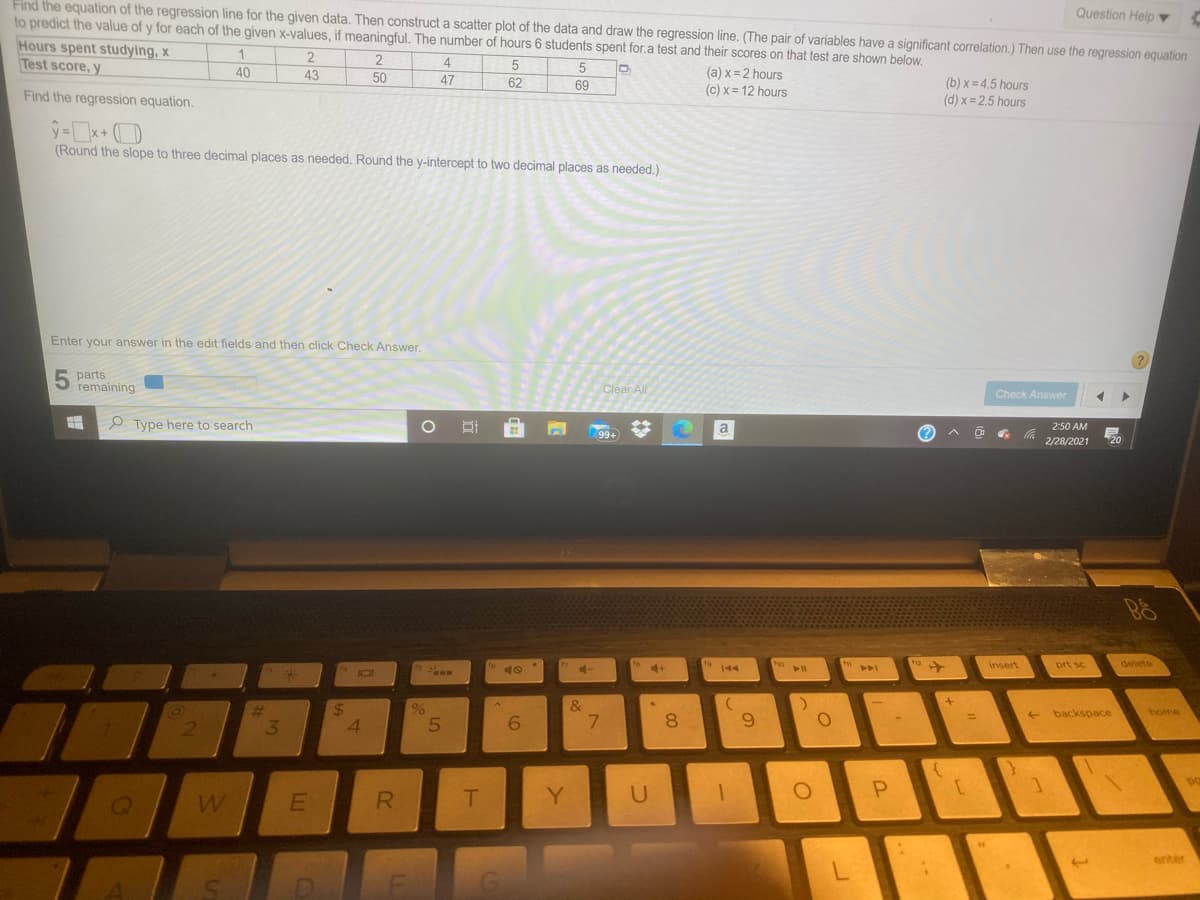
(THe pair of variables have a significant correlation.) Then use the regression equatic muaningful. The number of hours 6 students spent for.a test and their scores on that test are shown below, Hours spent studying, x Test score, y 2 4 5 (a) x = 2 hours (c) x = 12 hours (b) x = 4.5 hours (d) x = 2.5 hours 40 43 50 47 62 69 Find the regression equation.

Functions and Change: A Modeling Approach to College Algebra (MindTap Course List)
6th Edition
ISBN:9781337111348
Author:Bruce Crauder, Benny Evans, Alan Noell
Publisher:Bruce Crauder, Benny Evans, Alan Noell
Chapter3: Straight Lines And Linear Functions
Section3.CR: Chapter Review Exercises
Problem 15CR: Life Expectancy The following table shows the average life expectancy, in years, of a child born in...
icon
Related questions
icon
Concept explainers
Question
Find the equation of the regression line for the given data. Then construct a scatter plot of the data and draw the regression line. (The pair of variables have a significant correlation.) Then use the regression equation
Question Help v
to predict the value of y for each of the given x-values, if meaningful. The number of hours 6 students spent for.a test and their scores on that test are shown below.
Hours spent studying, x
Test score, y
1
4
5
40
(a) x = 2 hours
(c) x = 12 hours
43
50
47
62
69
(b) x = 4.5 hours
(d) x = 2.5 hours
Find the regression equation.
(Round the slope to three decimal places as needed. Round the y-intercept to two decimal places as needed.)
Enter your answer in the edit fields and then click Check Answer.
5 parts
remaining
Clear All
Check Answer
P Type here to search
a
2:50 AM
99+
2/28/2021
20
t9 144
delete
41
ho
insert
prt sc
IDI
&
7.
%
backspace
home
21
3.
4.
6.
8.
9.
R
T
Y
enter
L
Transcribed Image Text:Find the equation of the regression line for the given data. Then construct a scatter plot of the data and draw the regression line. (The pair of variables have a significant correlation.) Then use the regression equation Question Help v to predict the value of y for each of the given x-values, if meaningful. The number of hours 6 students spent for.a test and their scores on that test are shown below. Hours spent studying, x Test score, y 1 4 5 40 (a) x = 2 hours (c) x = 12 hours 43 50 47 62 69 (b) x = 4.5 hours (d) x = 2.5 hours Find the regression equation. (Round the slope to three decimal places as needed. Round the y-intercept to two decimal places as needed.) Enter your answer in the edit fields and then click Check Answer. 5 parts remaining Clear All Check Answer P Type here to search a 2:50 AM 99+ 2/28/2021 20 t9 144 delete 41 ho insert prt sc IDI & 7. % backspace home 21 3. 4. 6. 8. 9. R T Y enter L
Expert Solution
steps

Step by step

Solved in 2 steps with 1 images

Blurred answer
Knowledge Booster
Correlation, Regression, and Association
Learn more about
Need a deep-dive on the concept behind this application? Look no further. Learn more about this topic, statistics and related others by exploring similar questions and additional content below.
Recommended textbooks for you
Functions and Change: A Modeling Approach to Coll…
Algebra
ISBN:
9781337111348
Author:
Bruce Crauder, Benny Evans, Alan Noell
Publisher:
Cengage Learning
Glencoe Algebra 1, Student Edition, 9780079039897…
Algebra
ISBN:
9780079039897
Author:
Carter
Publisher:
McGraw Hill
College Algebra
College Algebra
Algebra
ISBN:
9781337282291
Author:
Ron Larson
Publisher:
Cengage Learning
Algebra & Trigonometry with Analytic Geometry
Algebra
ISBN:
9781133382119
Author:
Swokowski
Publisher:
Cengage
Algebra and Trigonometry (MindTap Course List)
Algebra
ISBN:
9781305071742
Author:
James Stewart, Lothar Redlin, Saleem Watson
Publisher:
Cengage Learning