Find the equation of the regression line for the given data. Then construct a scatter plot of the data and draw the regression line. (The pair of variables have a significant correlation.) Then use the regression equation to predict the value of y for each of the given x-values, if meaningful. The number of hours 6 students spent for a test and their scores on that test are shown below. Hours spent studying, x Test score, y 1 3 (a) x = 2 hours (c) x = 12 hours (b) x = 3.5 hours 38 45 50 48 65 72 (d) x=2.5 hours Find the regression equation. (Round the slope to three decimal places as needed. Round the y-intercept to two decimal places as needed.) Choose the correct graph below. O A. OB. OC. OD. 80- 80- 80- 80- Q 0- Hours studying 0. Hours studying Hours studying Hours studying (a) Predict the value of y for x= 2. Choose the correct answer below. O A. 51.0 O B. 48.1 O C. 56.9 O D. not meaninaful Test score Test score Test score Test score
Find the equation of the regression line for the given data. Then construct a scatter plot of the data and draw the regression line. (The pair of variables have a significant correlation.) Then use the regression equation to predict the value of y for each of the given x-values, if meaningful. The number of hours 6 students spent for a test and their scores on that test are shown below. Hours spent studying, x Test score, y 1 3 (a) x = 2 hours (c) x = 12 hours (b) x = 3.5 hours 38 45 50 48 65 72 (d) x=2.5 hours Find the regression equation. (Round the slope to three decimal places as needed. Round the y-intercept to two decimal places as needed.) Choose the correct graph below. O A. OB. OC. OD. 80- 80- 80- 80- Q 0- Hours studying 0. Hours studying Hours studying Hours studying (a) Predict the value of y for x= 2. Choose the correct answer below. O A. 51.0 O B. 48.1 O C. 56.9 O D. not meaninaful Test score Test score Test score Test score

Functions and Change: A Modeling Approach to College Algebra (MindTap Course List)
6th Edition
ISBN:9781337111348
Author:Bruce Crauder, Benny Evans, Alan Noell
Publisher:Bruce Crauder, Benny Evans, Alan Noell
Chapter3: Straight Lines And Linear Functions
Section3.CR: Chapter Review Exercises
Problem 15CR: Life Expectancy The following table shows the average life expectancy, in years, of a child born in...

Related questions

Question
And for rest of D question that I couldn't fit into the picture
c. 107.1
d. Not meaningful
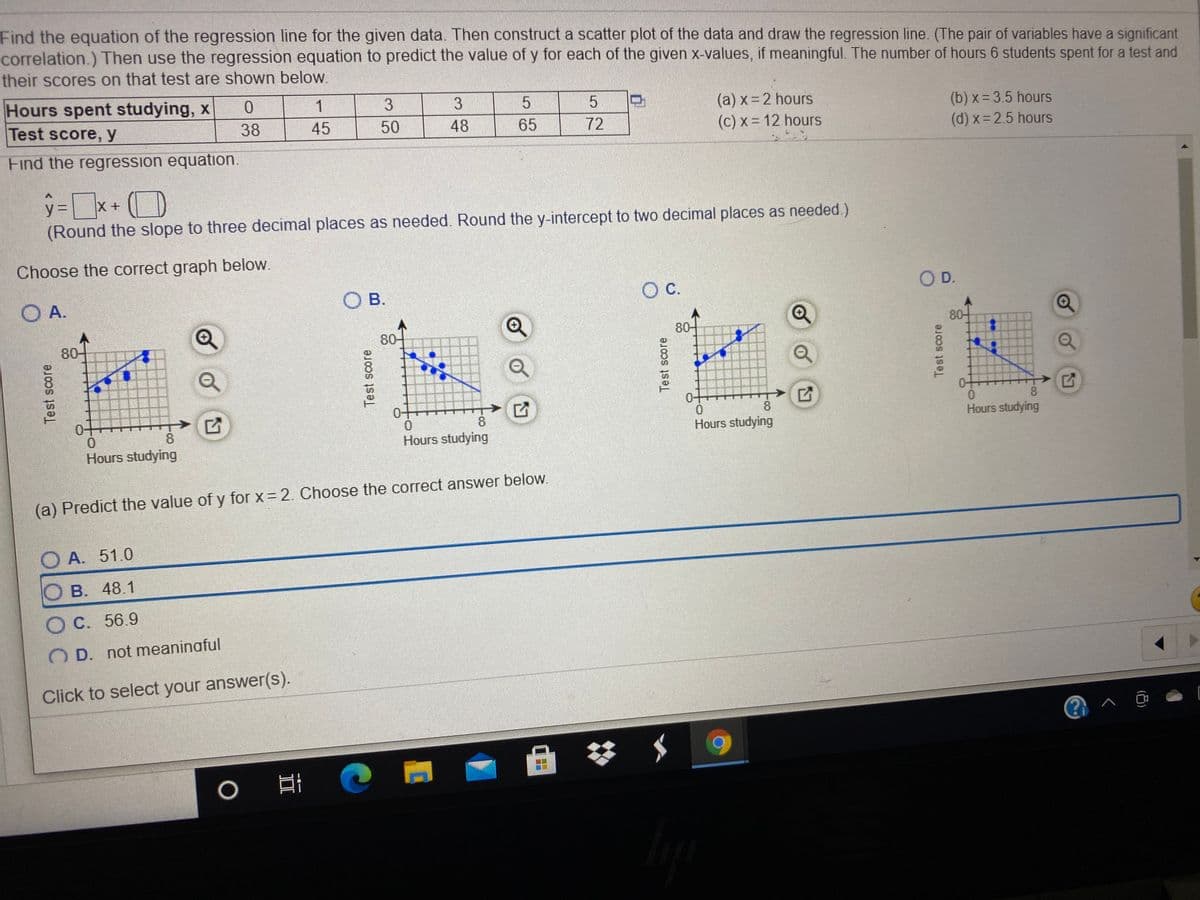
Transcribed Image Text:Find the equation of the regression line for the given data. Then construct a scatter plot of the data and draw the regression line. (The pair of variables have a significant
correlation.) Then use the regression equation to predict the value of y for each of the given x-values, if meaningful. The number of hours 6 students spent for a test and
their scores on that test are shown below.
Hours spent studying, x
Test score, y
1
3.
3
(a) x=2 hours
(c) x= 12 hours
(b) x= 3.5 hours
(d) x= 2.5 hours
38
45
50
48
65
72
Find the regression equation.
y%3D
(Round the slope to three decimal places as needed. Round the y-intercept to two decimal places as needed.)
Choose the correct graph below.
O B.
C.
OD.
O A.
80-
80-
80-
80-
0+
0.
Hours studying
0+
8
0-
8.
0-
8
8
Hours studying
Hours studying
Hours studying
(a) Predict the value of y for x = 2. Choose the correct answer below.
O A. 51.0
B. 48.1
O C. 56.9
O D. not meaninaful
Click to select your answer(s).
Test score
II
Test score
Test score
Test score
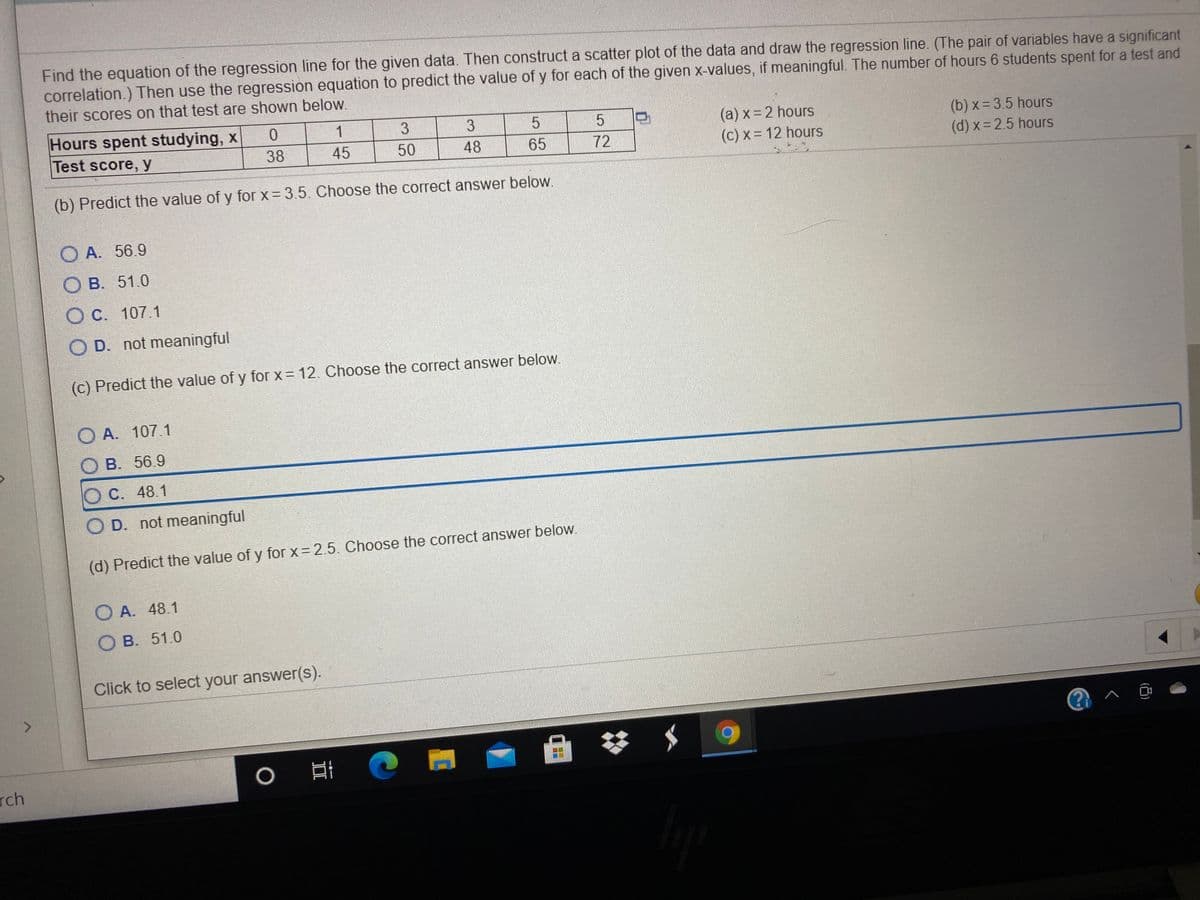
Transcribed Image Text:Find the equation of the regression line for the given data. Then construct a scatter plot of the data and draw the regression line. (The pair of variables have a significant
correlation.) Then use the regression equation to predict the value of y for each of the given x-values, if meaningful. The number of hours 6 students spent for a test and
their scores on that test are shown below.
Hours spent studying, x
Test score, y
1
3
(a) x= 2 hours
(c) x= 12 hours
(b) x = 3.5 hours
(d) x= 2.5 hours
38
45
50
48
65
72
(b) Predict the value of y for x= 3.5. Choose the correct answer below.
O A. 56.9
О В. 51.0
O C. 107.1
O D. not meaningful
(c) Predict the value of y for x = 12. Choose the correct answer below.
O A. 107.1
В. 56.9
O C. 48.1
O D. not meaningful
(d) Predict the value of y for x = 2.5. Choose the correct answer below.
O A. 48.1
O B. 51.0
Click to select your answer(s).
<>
rch
Expert Solution
This question has been solved!
Explore an expertly crafted, step-by-step solution for a thorough understanding of key concepts.

This is a popular solution!

Trending now
This is a popular solution!

Step by step
Solved in 4 steps with 2 images

Knowledge Booster


Learn more about
Need a deep-dive on the concept behind this application? Look no further. Learn more about this topic, statistics and related others by exploring similar questions and additional content below.Recommended textbooks for you
Functions and Change: A Modeling Approach to Coll…
Algebra
ISBN:
9781337111348
Author:
Bruce Crauder, Benny Evans, Alan Noell
Publisher:
Cengage Learning

Elementary Linear Algebra (MindTap Course List)
Algebra
ISBN:
9781305658004
Author:
Ron Larson
Publisher:
Cengage Learning

Glencoe Algebra 1, Student Edition, 9780079039897…
Algebra
ISBN:
9780079039897
Author:
Carter
Publisher:
McGraw Hill
Functions and Change: A Modeling Approach to Coll…
Algebra
ISBN:
9781337111348
Author:
Bruce Crauder, Benny Evans, Alan Noell
Publisher:
Cengage Learning
Elementary Linear Algebra (MindTap Course List)
Algebra
ISBN:
9781305658004
Author:
Ron Larson
Publisher:
Cengage Learning
Glencoe Algebra 1, Student Edition, 9780079039897…
Algebra
ISBN:
9780079039897
Author:
Carter
Publisher:
McGraw Hill

Algebra and Trigonometry (MindTap Course List)
Algebra
ISBN:
9781305071742
Author:
James Stewart, Lothar Redlin, Saleem Watson
Publisher:
Cengage Learning

Algebra & Trigonometry with Analytic Geometry
Algebra
ISBN:
9781133382119
Author:
Swokowski
Publisher:
Cengage
