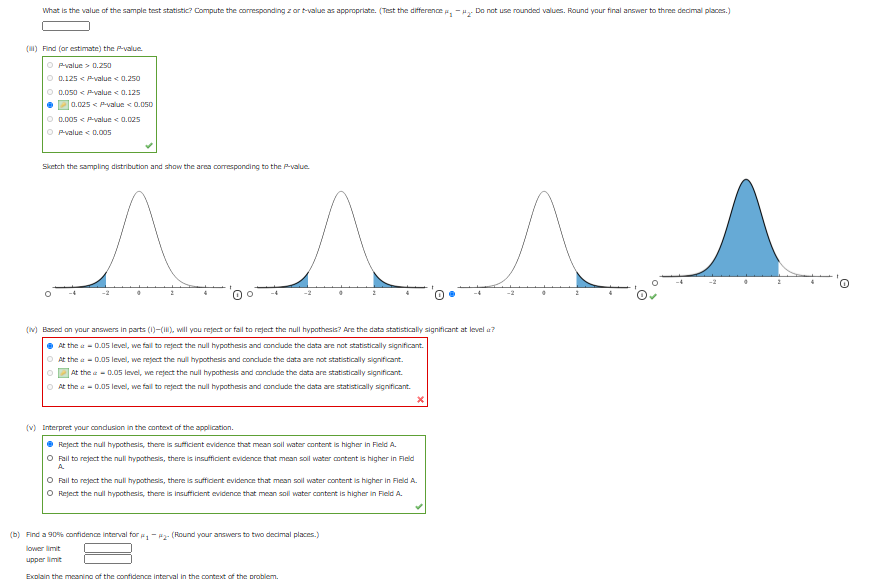
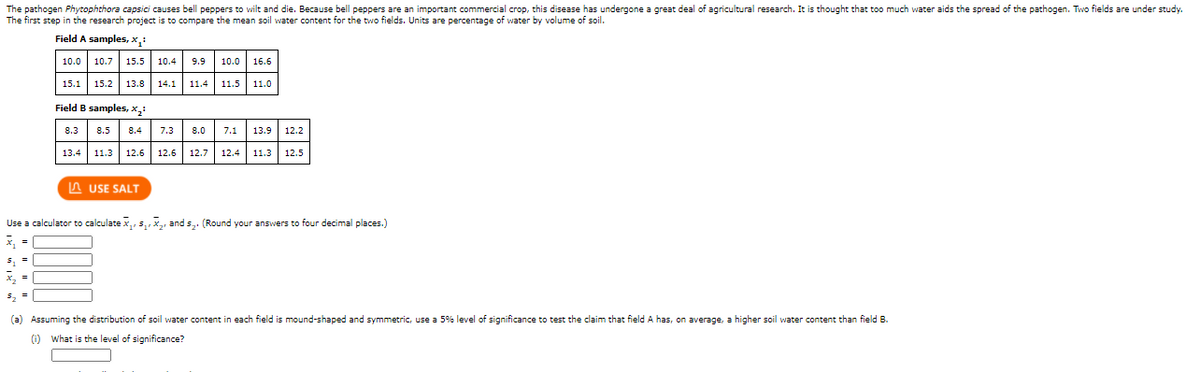
The pathogen Phytophthora capsici causes bell peppers to wilt and die. Because bell peppers are an important commercial crop, this disease has undergone a great deal of agricultural research. It is thought that too much water aids the spread of the pathogen. Two fields are under study. The first step in the research project is to compare the mean soil water content for the two fields. Units are percentage of water by volume of soil. Field A samples, x, 10.0 10.7 15.5 10.4 9.9 10.0 16.6 15.1 15.2 13.8 14.1 11.4 11.5 11.0 Field B samples, x, 8.3 8.5 8.4| 7.3 8.0 7.1 13.9 12.2 13.4 11.3 12.6 12.6 12.7 12.4 11.3 12.5 A USE SALT Use a calculator to calculate x,, s,,x,, and s,. (Round your answers to four decimal places.) 5, =

Glencoe Algebra 1, Student Edition, 9780079039897, 0079039898, 2018
18th Edition
ISBN:9780079039897
Author:Carter
Publisher:Carter
Chapter4: Equations Of Linear Functions
Section4.5: Correlation And Causation
Problem 15PPS
icon
Related questions
icon
Concept explainers
Topic Video
Question
What is the value of the sample test statistic? Compute the coresponding z ar t-value as appropriate. (Test the difference e, -H. Do not use rounded values. Round your final answer to three dedimal places.)
(1) Find (or estimate) the Pvalue
O Pvalue > 0.250
O 0.125 < Pvalue < 0.250
O D.050 < Pvalue < 0.125
0.025 < Pvalue 0.050
O D.005 < yalue < 0.025
O Pvalue < 0.005
Sketch the sampling distribution and show the area corresponding to the P-value
(v) Based on your answers in parts (1)-(), will you reject or fal to reject the null hypothesis? Are the data statistically significant at level a?
• At the a - D.05 level, we fall to reject the null hypothesis and conclude the data are not statistically significant.
O At the a - D.05 level, we reject the null hypothesis and conclude the data are not statistically significant.
At the e- 0.05 level, we reject the null hypothesis and conclude the data are statistically significant.
O At the a - D.05 level, we fal to reject the null hypothesis and condude the data are statistically significant.
(v) Interpret your condusion in the context of the application.
• Reject the null hypothesis, there is sufficient evidence that mean soll water content is higher in Field A.
O Fail to reject the null hypothesis, there is insufficent evidence that mean sol water content is higher in Field
A.
O Fail to reject the null hypothesis, there is sufficent evidence that mean sol water content is higher in Field A.
O Reject the null hypothesis, there is insufficient evidence that mean soll water content is higher in Field A.
(b) Find a 90% confidence interval for ,- P- (Round your answers to two decimal places.)
lower limit
upper limit
Explain the meaning of the confidence interval in the context of the problem.
Transcribed Image Text:What is the value of the sample test statistic? Compute the coresponding z ar t-value as appropriate. (Test the difference e, -H. Do not use rounded values. Round your final answer to three dedimal places.) (1) Find (or estimate) the Pvalue O Pvalue > 0.250 O 0.125 < Pvalue < 0.250 O D.050 < Pvalue < 0.125 0.025 < Pvalue 0.050 O D.005 < yalue < 0.025 O Pvalue < 0.005 Sketch the sampling distribution and show the area corresponding to the P-value (v) Based on your answers in parts (1)-(), will you reject or fal to reject the null hypothesis? Are the data statistically significant at level a? • At the a - D.05 level, we fall to reject the null hypothesis and conclude the data are not statistically significant. O At the a - D.05 level, we reject the null hypothesis and conclude the data are not statistically significant. At the e- 0.05 level, we reject the null hypothesis and conclude the data are statistically significant. O At the a - D.05 level, we fal to reject the null hypothesis and condude the data are statistically significant. (v) Interpret your condusion in the context of the application. • Reject the null hypothesis, there is sufficient evidence that mean soll water content is higher in Field A. O Fail to reject the null hypothesis, there is insufficent evidence that mean sol water content is higher in Field A. O Fail to reject the null hypothesis, there is sufficent evidence that mean sol water content is higher in Field A. O Reject the null hypothesis, there is insufficient evidence that mean soll water content is higher in Field A. (b) Find a 90% confidence interval for ,- P- (Round your answers to two decimal places.) lower limit upper limit Explain the meaning of the confidence interval in the context of the problem.
The pathogen Phytophthora capsici causes bell peppers to wilt and die. Because belI peppers are an important commercial crop, this disease has undergone a great deal of agricultural research. It is thought that too much water aids the spread of the pathogen. Two fields are under study.
The first step in the research project is to compare the mean soil water content for the two fields. Units are percentage of water by volume of soil.
Field A samples, x:
10.0 10.7 15.5 10.4
9.9
10.0
16.6
15.1 15.2 13.8 14.1 11.4 11.5 11.0
Field B samples, x,:
8.3
8.5
8.4 7.3 8.0
7.1 13.9
12.2
13.4 11.3
12.6 12.6 12.7 12.4 11.3 12.5
A USE SALT
Use a calculator to calculate x,, s,,x,, and s,. (Round your answers to four decimal places.)
x,
(a) Assuming the distribution of soil water content in each field is mound-shaped and symmetric, use a 5% level of significance to test the claim that field A has, on average, a higher soil water content than field B.
(1) What is the level of significance?
Transcribed Image Text:The pathogen Phytophthora capsici causes bell peppers to wilt and die. Because belI peppers are an important commercial crop, this disease has undergone a great deal of agricultural research. It is thought that too much water aids the spread of the pathogen. Two fields are under study. The first step in the research project is to compare the mean soil water content for the two fields. Units are percentage of water by volume of soil. Field A samples, x: 10.0 10.7 15.5 10.4 9.9 10.0 16.6 15.1 15.2 13.8 14.1 11.4 11.5 11.0 Field B samples, x,: 8.3 8.5 8.4 7.3 8.0 7.1 13.9 12.2 13.4 11.3 12.6 12.6 12.7 12.4 11.3 12.5 A USE SALT Use a calculator to calculate x,, s,,x,, and s,. (Round your answers to four decimal places.) x, (a) Assuming the distribution of soil water content in each field is mound-shaped and symmetric, use a 5% level of significance to test the claim that field A has, on average, a higher soil water content than field B. (1) What is the level of significance?
Expert Solution
trending now

Trending now

This is a popular solution!

steps

Step by step

Solved in 3 steps with 3 images

Blurred answer
Knowledge Booster
Centre, Spread, and Shape of a Distribution
Learn more about
Need a deep-dive on the concept behind this application? Look no further. Learn more about this topic, statistics and related others by exploring similar questions and additional content below.
Recommended textbooks for you
Glencoe Algebra 1, Student Edition, 9780079039897…
Algebra
ISBN:
9780079039897
Author:
Carter
Publisher:
McGraw Hill
Algebra: Structure And Method, Book 1
Algebra
ISBN:
9780395977224
Author:
Richard G. Brown, Mary P. Dolciani, Robert H. Sorgenfrey, William L. Cole
Publisher:
McDougal Littell
Big Ideas Math A Bridge To Success Algebra 1: Stu…
Algebra
ISBN:
9781680331141
Author:
HOUGHTON MIFFLIN HARCOURT
Publisher:
Houghton Mifflin Harcourt
College Algebra (MindTap Course List)
Algebra
ISBN:
9781305652231
Author:
R. David Gustafson, Jeff Hughes
Publisher:
Cengage Learning
Holt Mcdougal Larson Pre-algebra: Student Edition…
Algebra
ISBN:
9780547587776
Author:
HOLT MCDOUGAL
Publisher:
HOLT MCDOUGAL