Using all the data in the image, calculate and interpret the following: 1. Mean 2. Standard Variation 3. Skewness


Q: Approximate the percentile rank of the data value 12. 12, 8, 11, 19, 14, 13, 4, 20 O 69th percentile…
A:
Q: What is the scale of measurement that is most appropriate for each of the following variables? •…
A: For any measurement , data can be classified as being on one of four scales: nominal, ordinal,…
Q: a. Provide the following: - Response Variable: Treatment and levels: Experimental Unit:
A: Response variable is the variable in which we are interested to measure the change wheater it is…
Q: In Exercises, we have provided simple data sets for you to practice the basics of finding a…
A: The data is 4, 0, 5. The population size is 3.
Q: Calculate t for a comparison for repeated-measures data?
A: The computational procedure is to compute the difference between each pair of observations (di)…
Q: 5. The amount of television viewed by today's youth is of primary concern to Parents Against…
A: Quantitative data is a type of data which is possible to measure on the numeric scale. It must be…
Q: For Problem 19.33 , determine the probability (assuming normal distribution) that a bottle would be…
A: The frequency distribution table is given below: The formula to find mean for any sample is,…
Q: The ordinal level of measurement is represented in which variable below? race income IQ position in…
A: We know, there are four levels of measurements : i) Nominal ii) ordinal iii) interval iv) ratio.…
Q: Draw a box and whisker plot for the following data: 20 18 31 38 25 33 50 42…
A: Given data is, 20 18 31 38 25 33 50 42 Arrange the observations in ascending order. 18 20 25 31 33…
Q: Based on this histogram, draw the ogive (the cumulative relative frequency polygon) for the data.
A: By using the given histogram, the cumulative relative frequency is, Selling time Relative…
Q: (a) Determine the mean and the standard deviation for each data set.
A:
Q: In Exercise, we have provided simple data sets for you to practice the basics of finding measures of…
A: According to the provided information, a sample of 5 observation are givenThe range is defined as…
Q: Specify the mathematical symbol used for each of the following descriptive measures. a. Sample mean…
A:
Q: What is the coefficient of variation of a data, which has a standart deviation 28 and mean as 400?…
A:
Q: For the data described below, identify the level of measurement as nominal, ordinal, interval, or…
A: Q) For the data described below, identify the level of measurement as nominal, ordinal, interval,…
Q: What percent of the data fall below the 1st quartile? 1. 0% 2. 25% 3. 50% 4. 75% 5. 100%
A: The first quartile is denoted by Q1 and this is the median of lower half of the data set.
Q: Obtain two quartiles, 7th Decile and 68th percentile from the following items: S. No. : 1 2 4 5 6 7…
A:
Q: For the data described below, identify the level of measurement asnominal, ordinal, interval, or…
A: Nominal level:This level of measurement is used for names, gender and it categories the data. In…
Q: Use the following set of intestinal pH data. Calculate Pso (that is, the 50th Percentile., and place…
A: Calculate Percentiles-50 from the following data5,6,7,7,5,7,6,7,6,4
Q: What is the unit of observation in the dataset? A) The UK B) British Pound Sterling C) A person that…
A: given:The given survey is the smoking habits of the UK residents
Q: In Exercises, we have provided simple data sets for you to practice the basics of finding a…
A: The data is 2, 5, 0, –1. The population size is 4.
Q: Create a histogram using SPSS and the following data:
A:
Q: 5) Combine the data X and Y and let's say the data set Z. a) Calculate the 40th percentile of the…
A: These are the sample data that have been provided: Observation: Z 1 42 2 90 3 65 4 70 5…
Q: Identify the most appropriate measure of variation corresponding to each of the following measures…
A: -
Q: Using a spectrophotometric analytical technique, the glucose concentrations in a patient with mildly…
A: Given that The data are 16.67, 16.66, 16.64, 16.30, 16.31, 16.70
Q: In Exercises, we have provided simple data sets for you to practice the basics of finding a…
A: The data is 4, 2, 0, 2, and 2. The population size is 5.
Q: A college student wants to determine whether the stress level of a student is associated to his/her…
A:
Q: Classify the following data: The type of palm trees on the island of Oahu. Nominal Ordinal…
A: Nominal: When the possible observations are tags or categories or names, without any natural…
Q: The number of traffic violations recorded by a police department for 10 days is shown. Find the…
A:
Q: For the following data, calculate mean, deviation, standard deviation, median, variance and range
A: x (x-xbar) (x-xbar)^2 16.7724 -0.00054 0.00000029 16.7735 0.000562 0.00000032 16.7722 -0.00074…
Q: Calculate the 75% percentiles, 25% percentiles, and the IQR for the following data: 9, 12, 20,…
A: Given : Observation 9 12 20 5 14 7 16 13
Q: In Exercise, we have provided simple data sets for you to practice the basics of finding measures of…
A: a. Range:Range is the difference between maximum and minimum value in a data set.In the given data…
Q: The five number summary for the average annualwage per employee for each U.S state and D.C is given…
A: Here is given that, Min = 333532 Q1 = 38057 Q2 = 40577 Q3 = 46267.5 Max = 77843
Q: list the number of expenses for each day and create a graphical representation of the gathered data.…
A: list the number of expenses for each day and create a graphical representation of the gathered data.…
Q: Given the data set below, calculate the range, mean, variance, and standard deviation. 24, 38,…
A: Given data set, 24, 38, 21, 45, 15, 15, 27, 34, 10 Arranging the data set in sorted order. 10 , 15,…
Q: In comparing data sets, which of the following is to be used? mode range coefficient of…
A: To find: The measures which can be used to compare the data sets.
Q: An instructor recorded the following number of correct items (in a quiz with 10 questions) for the…
A: Here we had given that exam is multiple choice exam and the score is our variable. We had given 12…
Q: Which histogram is correct given the following data points above? What are the unusal values…
A: Histogram is graph, which a special type of bar chart with no gap between each bars. Thus, histogram…
Q: In Exercises, we have provided simple data sets for you to practice the basics of finding a…
A: The data is 1, 2, 4, 4. The population size is 4.
Q: (a) What height represents the 95th percentile? (b) What height represents the first quartile?
A: Given: The z score corresponding to the 95th percentile, i.e., p=0.95, i.e., 95% of the area of the…
Q: Find the 5 number summary for the data shown 13 24 27 28 38 45 46 48 52 78 84 90 5 number summary:…
A: The data given is: 13, 24, 27, 28, 38, 45, 46, 48, 52, 78, 84, 90 The 5 number summary includes: 1.…
Q: 26 26 22 27 28 14 8 21 7 27 11 10 7 22 25 Question 1 What is the median for the above-mentioned…
A:
Q: Find the 5 number summary for the data shown 17 21 29 30 36 42 56 60 88 91 94 97 5 number…
A: The data is given below 17 21 29 30 36 42 56 60 88 91 94 97
Q: FInd the Dispersion (Range, Variance, Standard Deviation, Coefficient of Variation - whichever is…
A: Dispersion is the measure that used to summarize the information of the larger data set without…
Q: a) 1st Quartile b) 2nd Decile c) 20th Percentile
A:
Q: 2. Which of the following is also equal to median score?* 75th percentile 5th decile 3rd…
A:
Q: In Exercise, we have provided simple data sets for you to practice the basics of finding measures of…
A: (a)The range of the data set is the difference between maximum value and minimum value. So the range…
Q: Which measure of center is most appropriate for this data? O median O mean
A: Right skewed distribution: If the distribution is longer towards the right tail, then the…
Q: Find the 55 th percentile for the data shown using the interpolation method (Definition 3) 1.6 2.3…
A:
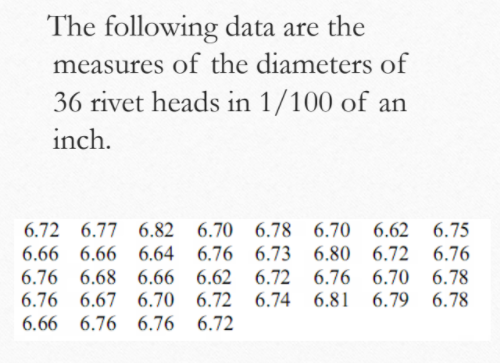
Using all the data in the image, calculate and interpret the following:
1. Mean
2. Standard Variation
3. Skewness
4. 50th Percentile

Step by step
Solved in 5 steps with 2 images

- Compute the cross-sectional area of the grooved block shown. Round the answer to 1 decimal place.Compute the number of cubic centimeters of material in the locating saddle shown. Round the answer to the nearest cubic centimeter.The following household items were found to have the dimensions Which item comes closest to having the proportions of the golden ratio? Standard sheet of paper: 8.5 in x 11 in Picture frame: 8in x 10in 35-mm slide: 35mm x 23mm
- Consider the region in Figure A. Its area, using ∫ab[?(?) − ?(?)]??, is ?The operations manager of a plant that manufactures tires wants to compare the actual inner diameters of two grades of tires, each of which is expected to be 575 millimeters. Samples of five tires from each grade were selected, and the results representing the inner diameters of the tires, ranked from smallest to largest, are shown below. Complete parts (a) through (b) below.1. Find the area of the indicated region:
- Why must the edge of the meter stick, rather than the broader side, be adjacent to the dimension being measured?Find the approximate area of the shaded region, given that the area of the sector is approximately 13.08 square units.Compute the following ratios and state your observations. distance from the ground to your belly button = _____ distance from your belly button to the top of your head