The peanut crop was harvested from five fields of various area. The following data are the mass of the crop fro kilograms) and the field areax (in hectares). y 7420 15740 13560 19820 13100 x 2.09 3.90 3.62 4.51 3.03 Round your intermediate answers to four decimal places (e.g. 98.7654). (a) Fit the simple linear regression model using the method of least squares. Find the estimate of o. Round your answer to the nearest integer (e.g. 9876). (b) What change in the mean mass is expected when the field area changes by 1 hectare? Round your answer to the nearest integer (e.g. 9876). (c) Calculate the fitted value of y corresponding to x = 2.09. Find the corresponding residual. Round your answer to the nearest integer (e.g. 9876).
The peanut crop was harvested from five fields of various area. The following data are the mass of the crop fro kilograms) and the field areax (in hectares). y 7420 15740 13560 19820 13100 x 2.09 3.90 3.62 4.51 3.03 Round your intermediate answers to four decimal places (e.g. 98.7654). (a) Fit the simple linear regression model using the method of least squares. Find the estimate of o. Round your answer to the nearest integer (e.g. 9876). (b) What change in the mean mass is expected when the field area changes by 1 hectare? Round your answer to the nearest integer (e.g. 9876). (c) Calculate the fitted value of y corresponding to x = 2.09. Find the corresponding residual. Round your answer to the nearest integer (e.g. 9876).

Linear Algebra: A Modern Introduction
4th Edition
ISBN:9781285463247
Author:David Poole
Publisher:David Poole
Chapter7: Distance And Approximation
Section7.3: Least Squares Approximation
Problem 31EQ

Related questions
Question
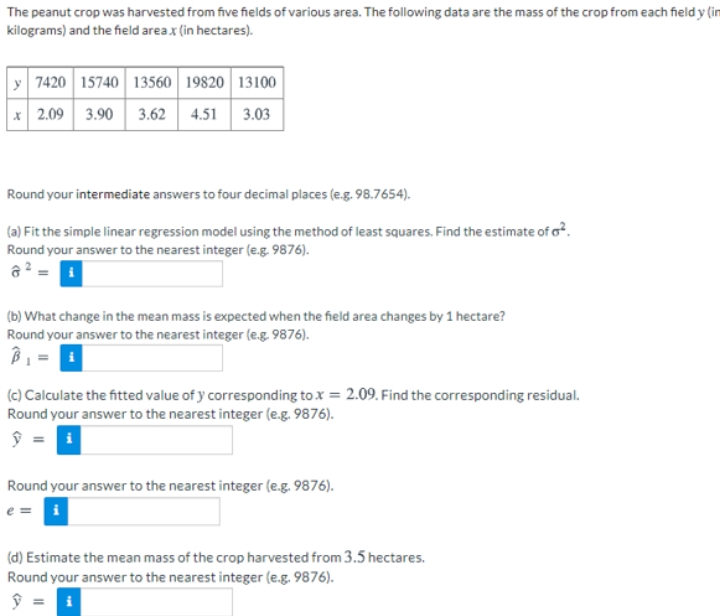
Transcribed Image Text:The peanut crop was harvested from five fields of various area. The following data are the mass of the crop from each field y (in
kilograms) and the field areax (in hectares).
y 7420 15740 13560 19820 13100
* 2.09
3.90 3.62 4.51 3.03
Round your intermediate answers to four decimal places (e.g. 98.7654).
(a) Fit the simple linear regression model using the method of least squares. Find the estimate of o?.
Round your answer to the nearest integer (e.g. 9876).
a? =
(b) What change in the mean mass is expected when the field area changes by 1 hectare?
Round your answer to the nearest integer (e.g. 9876).
(c) Calculate the fitted value of y corresponding to x = 2.09. Find the corresponding residual.
Round your answer to the nearest integer (e.g. 9876).
ŷ = i
Round your answer to the nearest integer (e.g. 9876).
e = i
(d) Estimate the mean mass of the crop harvested from 3.5 hectares.
Round your answer to the nearest integer (e.g. 9876).
Expert Solution
This question has been solved!
Explore an expertly crafted, step-by-step solution for a thorough understanding of key concepts.

Step by step
Solved in 7 steps

Recommended textbooks for you
Linear Algebra: A Modern Introduction
Algebra
ISBN:
9781285463247
Author:
David Poole
Publisher:
Cengage Learning

Functions and Change: A Modeling Approach to Coll…
Algebra
ISBN:
9781337111348
Author:
Bruce Crauder, Benny Evans, Alan Noell
Publisher:
Cengage Learning
Linear Algebra: A Modern Introduction
Algebra
ISBN:
9781285463247
Author:
David Poole
Publisher:
Cengage Learning
Functions and Change: A Modeling Approach to Coll…
Algebra
ISBN:
9781337111348
Author:
Bruce Crauder, Benny Evans, Alan Noell
Publisher:
Cengage Learning