The following data is representative of that reported in an article on nitrogen emissions, vith x = burner area liberation rate (MBtu/hr-ft?) and y = NO, emission rate (ppm): x| 100 125 125 150 150 200 200 250 250 300 300 350 400 400 y|140 130 170 220 200 320 290 390 430 440 400 590 600 660 A USE SALT (a) Assuming that the simple linear regression model is valid, obtain the least squares estimate of the true regression line. (Round all numerical values to four decimal places.) y = (b) What is the estimate of expected NO, emission rate when burner area liberation rate equals 250? (Round your answer to two decimal places.) ppm (c) Estimate the amount by which you expect NO, emission rate to change when burner area liberation rate is decreased by 50. (Round your answer to two decimal places.) ppm
The following data is representative of that reported in an article on nitrogen emissions, vith x = burner area liberation rate (MBtu/hr-ft?) and y = NO, emission rate (ppm): x| 100 125 125 150 150 200 200 250 250 300 300 350 400 400 y|140 130 170 220 200 320 290 390 430 440 400 590 600 660 A USE SALT (a) Assuming that the simple linear regression model is valid, obtain the least squares estimate of the true regression line. (Round all numerical values to four decimal places.) y = (b) What is the estimate of expected NO, emission rate when burner area liberation rate equals 250? (Round your answer to two decimal places.) ppm (c) Estimate the amount by which you expect NO, emission rate to change when burner area liberation rate is decreased by 50. (Round your answer to two decimal places.) ppm

Elementary Linear Algebra (MindTap Course List)
8th Edition
ISBN:9781305658004
Author:Ron Larson
Publisher:Ron Larson
Chapter2: Matrices
Section2.CR: Review Exercises
Problem 90CR

Related questions
Question
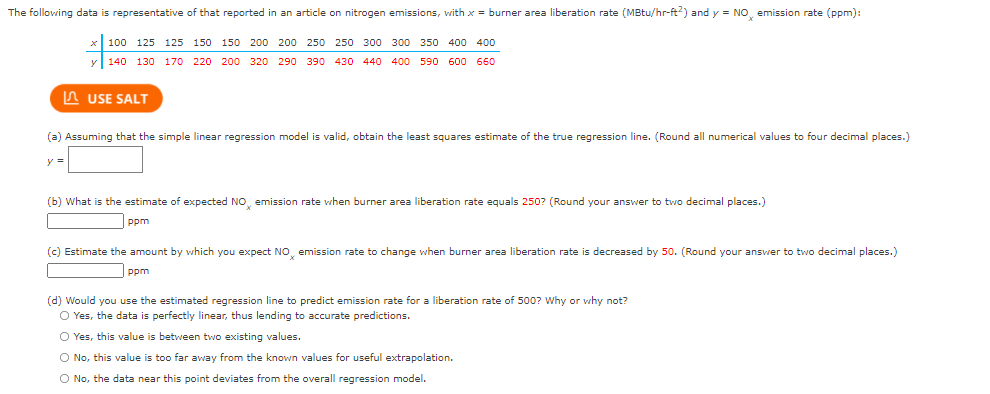
Transcribed Image Text:The following data is representative of that reported in an article on nitrogen emissions, with x = burner area liberation rate (MBtu/hr-ft?) and y = NO, emission rate (ppm):
100 125 125 150 150 200 200 250 250 300 300 350 400 400
140 130 170 220 200 320 290 390 430 440 400 590 600 660
IA USE SALT
(a) Assuming that the simple linear regression model is valid, obtain the least squares estimate of the true regression line. (Round all numerical values to four decimal places.)
(b) What is the estimate of expected NO emission rate when burner area liberation rate equals 250? (Round your answer to two decimal places.)
ppm
(c) Estimate the amount by which you expect NO, emission rate to change when burner area liberation rate is decreased by 50. (Round your answer to two decimal places.)
ppm
(d) Would you use the estimated regression line to predict emission rate for a liberation rate of 500? Why or why not?
O Yes, the data is perfectly linear, thus lending to accurate predictions.
O Yes, this value is between two existing values.
O No, this value is too far away from the known values for useful extrapolation.
O No, the data near this point deviates from the overall regression model.
Expert Solution
This question has been solved!
Explore an expertly crafted, step-by-step solution for a thorough understanding of key concepts.

This is a popular solution!

Trending now
This is a popular solution!

Step by step
Solved in 3 steps with 1 images

Recommended textbooks for you
Elementary Linear Algebra (MindTap Course List)
Algebra
ISBN:
9781305658004
Author:
Ron Larson
Publisher:
Cengage Learning

Functions and Change: A Modeling Approach to Coll…
Algebra
ISBN:
9781337111348
Author:
Bruce Crauder, Benny Evans, Alan Noell
Publisher:
Cengage Learning
Elementary Linear Algebra (MindTap Course List)
Algebra
ISBN:
9781305658004
Author:
Ron Larson
Publisher:
Cengage Learning
Functions and Change: A Modeling Approach to Coll…
Algebra
ISBN:
9781337111348
Author:
Bruce Crauder, Benny Evans, Alan Noell
Publisher:
Cengage Learning