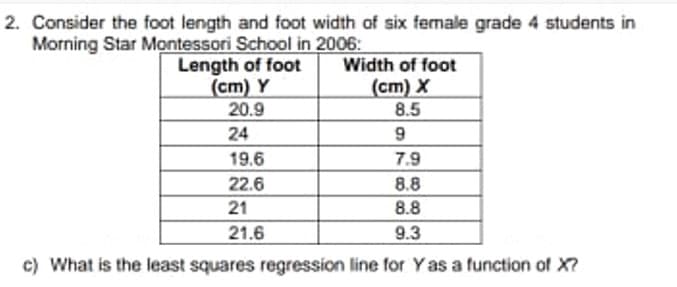
2. Consider the foot length and foot width of six female grade 4 students in Morning Star Montessori School in 2006: Length of foot (cm) Y 20.9 Width of foot (cm) X 8.5 24 9 19.6 7.9 22.6 8.8 21 8.8 21.6 9.3 c) What is the least squares regression line for Yas a function of X?


Q: 9. Which data set has the greatest coefficient of determination ()?
A: here use concept of correlation and coefficient of determination
Q: ellow balls. Find the probability of the given event, and show your punded to 4 decimal places when…
A: Given A ball is drawn randomly from a jar that contains 3 red balls, 2 white balls, and 7 yellow…
Q: To test whether the mean time needed to mix a batch of material is the same for machines produced by…
A: For the given data Find all the required blanks
Q: store of firearms sell submachine guns and pistols. The record of their sales shows of a probability…
A:
Q: II. In how many ways can the symbols ♡004444 can be arranged such that: (a) there are no…
A: The possible number of arrangement can be understand using the princple counting method. The…
Q: According to the tables used by insurance companies, a 39-year old woman has a 0.163% chance of…
A:
Q: The quality control manager at a computer manufacturing company believes that the mean life of a…
A: The quality control manager at a computer manufacturing company believes that the mean life of a…
Q: Internet tax: The Gallup Poll asked 1043 U.S. adults whether they believed that people should pay…
A:
Q: In 1999, the average percentage of women who received prenatal care per country is 80.1%. Table…
A: From the provided information, Sample size (n) = 46 Level of significance (α) = 0.05
Q: table lists the approximate values V of a mid-sized sedan for the years 2010 through 2016. The…
A: Given data indicates the value of V of a mid-sized sedan for the years 2010 through 2016 and t…
Q: Directions: Illustrate the rejection region given the critical value and identify if the t-values…
A:
Q: 1. Given the following data, which value corresponds to the 60t" percentile? 2. What is the…
A:
Q: The figure below shows the federal surplus or deficit from 1980 to 2015.
A: Given information: Given graph shows the federal surplus or deficit from 1980 to 2015.
Q: Critical values for quick reference during this activity. Confidence level Critical value 0.90 2* -…
A: Given that X=190 , n=1000
Q: Solve in digital format please Theoretically, a milk carton packer pours 1000 ml. per unit. A…
A: Given that Hypothesized Population Mean (\mu)(μ) = 10001000 Sample Standard Deviation (s)(s) =…
Q: 27. How did you make the determination in Question #26?
A: The given data points are: (1, 6), (3, 2), (4, 4), (5, 5), (7, 7), (8, 3)
Q: sample size is large, it does'nt matter what shape the distribution of the population it was drawn…
A: It is to be known about the central limit theorem is that When the sample size is large i.e. n is…
Q: Terri Vogel, an amateur motorcycle racer, averages 129.5 seconds per 2.5 mile lap (in a 7 lap race)…
A: Given that mu =1289.5 , s.d = 2.27
Q: the Venn diagram to name the events of the listed regions below. A B а. 8 b. 1 3 с. 2 d. 3, 6, 7, &…
A:
Q: A ball is drawn randomly from a jar that contains 8 red balls, 7 white balls, and 5 yellow balls.…
A: Solution
Q: Directions: Determine the parameter to be tested in each situation by writing your answer on a…
A: This question is asked to determine the test parameters such as mean, std dev, var etc. A parameter…
Q: 29. Based on what you found in #26, what is the proportion of variability in X that can be explained…
A: The coefficient of determination which is sometimes called R squared is the measure of variability…
Q: 49. If a set of X and Y scores has a Pearson correlation ofr= 0.50, 50% of the variability in Y…
A: We have given the statement about the Pearson correlation.
Q: Population Positive Covid 19 No Name density/Km2 Day 1 Day 2 Day 3 Day 4 Day 5 Day 6 Day 7 Day 8 Day…
A: First we enter the given data set in Excel file. Add all the day's values and create a new column…
Q: (ΣΥ SP --ΣΧ- SS =Ex²- SS, = EY?. SP = r3= VSS SS, n n Use this set of data to answer questions #1 -…
A: We have given that the data of 7 participants A, B, C, D, E, F and G.
Q: d. Between 2 and 9 (including 2 and 9) of them live in poverty.
A: Given that Number of trials n=47 Success of probability p=0.10 X~binomial (n,p)
Q: 25. How did you make the determination in Question #24?
A: Using the given figure, we need to test for the significance of correlation coefficient between X…
Q: The data represent the results for a test for a certain disease. Assume one individual from the…
A: Given
Q: A smart phone manufacturer is interested in constructing a 99% confidence interval for the…
A: Given that X=85 , n=1700
Q: A golf association requires that golf balls have a diameter that is 1.68 inches. To determine if…
A: Given Mean=1.68 n=12
Q: Suppose a researcher is testing the hypothesis Hn: p= 0.6 versus H,: p<0.6 and she finds the P-value…
A: Given : P-value = 0.28
Q: Suppose a free throw shooter makes 67 percent of their first attempts. On the second attempt they…
A:
Q: The amount of time that people spend at Grover Hot Springs is normally distributed with a mean of 64…
A: GivenMean(μ)=64standard deviation(σ)=16
Q: Express the confidence interval (12.2 % , 30.2 % ) in the form of p ± E.
A: Given that Confidence interval (12.2% , 30.2%) Lower limit =12.2%=0.122 Upper limit =30.2%=0.302
Q: Let X1,...,X, be independent random variables with pdfs f(z:(0) = { 0 -i(0 – 1) 0. Find a…
A:
Q: Use the Wording of Final Conclusion flow chart interactive to answer the following question. When…
A: Solution-: We want to correct wording of the final conclusion?
Q: What is the relationship between the number of minutes per day a woman spends talking on the phone…
A: The independent variable is Time. The dependent variable is Pounds. We have to find the prediction…
Q: A regular bus ride departs on time has a probability of 71%; the probability that it arrives on time…
A: D=departure Given P(D)=71%=0.71, P(A)=43% =0.43 P(D ⋂ A)=36%=0.36 =P(D and A)
Q: In 2008, there were 507 children in Arizona out of 32,601 who were diagnosed with Autism Spectrum…
A:
Q: 2. What is your null hypothesis? (in words)
A: Given that Here Number of participant =7
Q: Albumin is a liver protein that helps with circulation of hormones, vitamins, and enzymes throughout…
A: Given Information: μ1=34.1σ=7.13Power=90%Confidence level=95%
Q: (c) What is the point estimate (in dollars) of the difference between the population means? $ 840…
A:
Q: 1. How does the cost of shipping a standard-sized crate relate to the distance of the destination?…
A:
Q: Perform a test of hypothesis at 5% level of significance to help the labour union leader make an…
A: Here population standard deviation unknown so use t-test
Q: Maintaining your balance may get harder as you grow older. A study was conducted to see how steady…
A:
Q: Within the nexXt two years. An inexpensive suppressor, which would provide protection for only one…
A: here given, The owner of a small firm has just purchased a personal computer, which she expects will…
Q: The following results were obtained from statistical software: Syx (regression standard error) =…
A: From the above data Coefficient of determination 0.665
Q: It is advertised that the average braking distance for a small car traveling at 65 miles per hour…
A: Given that Hypothesized Population Mean (\mu)(μ) = 120120 Population Standard Deviation…
Q: Globally, 35% of all ridged brittleshell tortoises have spots on their shells. A herpetologist in…
A: Solution
Q: Consider the following time series data. Month 1. 3 4 5 6 7 Value 20 11 19 11 19 22 15 Round your…
A:

Step by step
Solved in 2 steps

- 1. Prior to being hired, the ve salespersons for a computer store were given a standard sales aptitude test. For each individual, the score achieved on the aptitude test and the number of computer systems sold during the first 3 months of their employment are shown in the attached image. (a) Determine the least-squares regression line and interpret its slope. (b) Estimate, for a new employee who scores 60 on the sales aptitude test, the number of units the new employee will sell in her first 3 months with the company. (c) Find the standard error of estimate. (d) Find the r-square of the model.(g) Compute the sum of the squared residuals for the least-squares regression line found in part (d).5/15 compute the sum of the squared residuals for the least squares regression line found in part a. Type an integer or a decimal.
- The following table presents the percentage of students who tested proficient in reading and the percentage who tested proficient in math for 5 randomly selected states in the United States. Compute the least-squares regression line for predicting math proficiency from reading proficiency. State Percent Proficientin Reading Percent Proficientin Mathematics Illinois 75 70 North Carolina 71 73 California 60 59 Georgia 67 64 Florida 66 68 Send data to Excel The equation for the least squares regression line is y = . Round the slope and y -intercept to four decimal places as needed.An owner of a home in the Midwest installed solar panels to reduce heating costs. After installing the solar panels, he measured the amount of natural gas used y (in cubic feet) to heat the home and outside temperature x (in degree-days, where a day's degree-days are the number of degrees its average temperature falls below 65° F) over a 23-month period. He then computed the least-squares regression line for predicting y from x and found it to be ŷ = 85 + 16x. The software used to compute the least-squares regression line for the equation above says that r2 = 0.98. This suggests which of the following? 1. Gas used increases by square root of 0.98 = 0.99 cubic feet for each additional degree-day? 2. Although degree-days and gas used are correlated, degree-days do not predict gas used very accurately. 3. Prediction of gas used from degree-days will be quite accurate.11/15 find the least squares regression line treating number of absences as the explanatory variable and the final exam score as the response variable. Round to three decimal places as needed.
- 2. An article in the Tappi Journal (March, 1986) presented data on green liquor Na2S concentration (in grams per liter) and paper machine production (in tons per day). The data (read from a graph) are shown as follows: (a) Fit a simple linear regression model with y green liquor Na2S concentration and x production. Draw a scatter diagram of the data and the resulting least squares fitted model.(b) Find the fitted value of y corresponding to x = 910 and the associated residual.The regional transit authority for a major metropolitan area wants to determine whetherthere is any relationship between the age of a bus and the annual maintenance cost. Asample of 10 buses resulted in the following data. Age of Bus (year) Maintenance Cost ($) 1 350 2 370 2 480 2 520 2 590 3 550 4 750 4 800 5 790 5 950 a. Develop the least squares estimated regression equation.b. Test to see whether the two variables are significantly related with α = .5.c. Did the least squares line provide a good fit to the observed data? Explain.d. Develop a 95% prediction interval for the maintenance cost for a specific bus thatis 4 years old.2. A company that holds the DVD distribution rights to movies previously released only in theaters wants to estimate sales revenue of DVDs based on box office success. The box office gross (in Php millions) for each of 22 movies in the year that they were released and the DVD revenue (in Php millions) in the following year are shown below and stored in (pic) a. construct a scatter plot. b. assuming a linear relationship, use the least-squares method to determine the regression coefficients b0 and b1.
- A financial analyst is examining the relationship between stock prices and earnings per share. She chooses sixteen publicly traded companies at random and records for each the company's current stock price and the company's earnings per share reported for the past 12 months. Her data are given below, with x denoting the earnings per share from the previous year, and y denoting the current stock price (both in dollars). Based on these data, she computes the least-squares regression line to be ŷ =−0.2390+0.044x. This line, along with a scatter plot of her data, is shown below.The data regarding the production of wheat in tons (X) and the price of the kilo of flour in Ghana cedis (Y) Takoradi some years ago were: a. Fit the regression line for the day using the method of least squaresAn administrator wants to investigate the relationship between the numbers of unauthorized days that employees are absent per year and the distance (miles) between home and work for the employees. A sample of 10 employees was chosen, and the following data were collected. Distance to Work (miles) 2 4 6 6 9 8 10 12 12 15 Number of Days Absent 8 5 8 6 6 4 6 3 5 3 Develop the least square regression line to predict the number of days absent based on the distance to work. Enter the regression coefficients in xx.xxx format. Round the value to three decimals and use leading and trailing zero to exactly match the format. Include the negative sign (minus sign) if the coefficient is negative. Do not include plus sign in your response. For example, if the coefficient is +6.1563 then enter 06.156 as your answer, if the coefficient is -0.54765 then enter -00.548 and if the answer is -1.6435 then enter -01.644 Ŷ=b0+b1X Constant/intercept…
