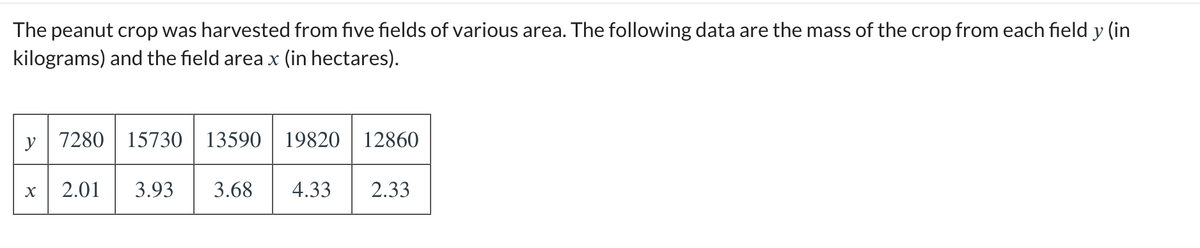
The peanut crop was harvested from five fields of various area. The following data are the mass of the crop from each field y (in kilograms) and the field area x (in hectares). y 7280 15730 13590 19820 x 12860 2.01 3.93 3.68 4.33 2.33
Q: Question 1) Suppose that T follows a t distribution with r = 15 degrees of freedom. Find the…
A: Note: Hey there! Thank you for posting the question. Since your question has more than 3 parts, we…
Q: The pmf of the amount of memory X (GB) in a purchased flash drive is given as the following. 1 4 8…
A: Solution
Q: On the right are the amounts (to the nearest $10) paid by 20 college students for textbooks during…
A: Given that Arrange the data set in ascending order. 210, 220, 250, 280, 280, 290, 350, 350, 410,…
Q: A researcher collected a data set for a random sample of 930 individuals living in and around…
A: Given Information: The independent variables are: Commuting time, Age, Hours worked, Log of real…
Q: Out of 600 people sampled, 228 had kids. Based on this, construct a 90% confidence interval for the…
A: The following information is given Sample size n=600 Number of kids x= 228 Proportion p^=228600=0.88…
Q: (c) دریا x?y -
A: To expand ∑Xi2yi3 :i=1,2,... K
Q: Please help me to find the trend values by using the moving average method (Correct to three decimal…
A: It is given that the data on quarters for three years. To find the trend values by using the moving…
Q: The accompanying data provides the results of a survey of 27 employees in a tax division of a…
A: Given data: Female Male 18 9 4 15 6 27 20 9 7 24 9 28 6 18 7 3 8 20 8 22…
Q: The following is a set of data from a sample of n = 7. 13 9 15 12 11 4 3 (a) Compute the first…
A: From given data we have : 13,9,15,12,11,4,3 Arranging Observations in the ascending order, We get…
Q: A cognitive psychologist was interested in the ability of men and women to multitask—a cognitive…
A: From the provided information, Number of men = 5 Number of women = 8 Psychologist found that men…
Q: Question 14 The shape of Normal distribution and t-distribution is Symmetric O Skewed to right…
A: We have given the statement The shape of normal distribution and t-distribution is
Q: What is the probability they will have type O blood and Rh negative?
A: Given that, P(type O blood) = 44% = 0.44 P(type A blood) = 42% = 0.42 P(type B blood) = 10% = 0.10…
Q: Among all cars in a junkyard, 10% of them lasted for more than 15 years. If you randomly…
A: The binomial distribution is used to indicate a probability distribution in which a random variable…
Q: Q6) An eight-man committee is to be formed from a group of 10 welsh-men and 15 Englishmen. In how…
A: Group : 10 Welsh - men and 15 Englishman Committee = 8 men should be selected Formula : If we…
Q: Two samples are taken with the following numbers of successes and sample sizes X1 38 x2 = 21 n₁ = 73…
A: Given that n1=73, n2=85
Q: In a study of cell phone usage and brain hemispheric dominance, an Intemet survey was e-mailed to…
A: Given The data is as follows: α=0.01 Sample size, n=6994 No. of success, x=1311
Q: can you please find the correlation coeffecient?
A: First, define the dependent and independent variables for the correlation coefficient computation.…
Q: A study of 1000 randomly selected flights of a major airline showed that 798 of the flights arrived…
A: Given that A study of 1000 randomly selected flights of a major airline showed that 798 of the…
Q: Consider the following data representing the daily calorie intake for dieters. 1261, 1253, 1348,…
A: Given data: 1261, 1253, 1348, 1280, 1334, 1305, 1346, 1192, 1358, 1133, 1343, 1156, 1359, 1281,…
Q: . D 1 2 3 # 5 5 7 3 9 5 1 2 3 4 5 5 7 3 9 D 1 2 Member of the Baseball Hall of Fame P 2 P P 1 P H 1…
A: Note: Hi! Thank you for the question, As per the honor code, we are allowed to answer three…
Q: Wipe you findinion's Calendare de expected ste el veran el aument Expl mees Ah 1.5, the expected
A: Hi thank you for posting this question as per follow up we have answer question four for you,…
Q: A survey of 500 college students moving into their dorm revealed that 425 brought a microwave, 380…
A: The sample size is N=500 The event M is brought a microwave The event C is brought a video game…
Q: Two dice are rolled. What is the probability of having both faces the same (doubles) or a total of…
A: The question is about probability Introduction : If two dice are rolled then possible outcomes can…
Q: In 2011 the U.S. Department of Transportation reported with 95% confidence that the average length…
A: Given that Mean=M=9.72, Margin of error=M.E=0.22
Q: 7. Make a pictograph to represent the categorical data in the following table representing the…
A: Pictograph to represent the categorical data : Bar graph is best Pictograph to represent the…
Q: An art dealer is interested in testing two hypotheses. The first is that paintings sell for the same…
A:
Q: The researchers realize that the scale was not accurate for the individual weighing 300 pounds, so…
A: Given that The researchers realize that the scale was not accurate for the individual weighing 300…
Q: Suppose that X ∼ N(0,1). Compute E[X^2],E[X^3] and E[X^k]. (Hint: integration by parts may be…
A: Solution
Q: aniance. through Х2 3 1 G x3 955 4 6 matm x
A: 1)Estimation variances via matrix Given the model: Y = β0 + β1X1 + β2X2 + β3X3 + ε, The…
Q: a. Fill in the following frequency table using the data. Dividend Yield 2.5 to <3.0 3.0 to <3.5 3.5…
A: Answer:- Given data table --
Q: The mean and standard deviation of standard normal distribution are 0 & 1 respectively. True False
A: Answer: Given that, The mean and standard deviation of standard normal distribution are 0 and 1…
Q: In an evaluation of a new classification algorithm, a sample of 1200 images randomly extracted from…
A: Since you have posted a question with multiple sub-parts, we will provide the solution only to the…
Q: The graph illustrates a normal distribution for the prices paid for a particular model of HD…
A: We have given that Mean(µ) = 1200Standard deviations (σ) = 85X ~ N (µ, σ )= N(1200, 85)
Q: standard form is Z= (X-E(X)) / sigma where sigma^2 = Var(X). Compute Var(Z).
A: Given that Standard form Z=(X-E(X))/sigma Z=(X-µ)/σ E(X)=µ, Sigma=σ, Sigma2=σ2=Var(X)
Q: A statistic is a measure that describes a population characteristic.
A: Given data : A statistic is a measure that describe a population characteristic.
Q: (a) Algebraically, what does the sum of squares function become? (b) Find a formula for estimating…
A: Solution:
Q: According to Mars, Incorporated, 20.5% of the M&M'S® Milk Chocolate Candies made at its Cleveland…
A: As per our guidelines we are supposed to answer only one question and 3 subparts of the same…
Q: A jar contains 7 poker chips: 4 blue, 2 red and 1 white. You randomly select two chips from the jar.…
A: Given,no.of blue chips(b)=4no.of red chips(r)=2no.of white chips(w)=1Total no.of chips=7
Q: An economics professor decides to curve the grades of his class. In doing so, he decides to make it…
A: The question is about normal dist. Given : Stud. who score top 8 % receive a grade A To find : How…
Q: A common measure of toxicity for any pollutant is the concentration of the pollutant that will kill…
A: Given that Sample size n1=8 , n2=6
Q: Use the table above to construct a probability distribution. Sample Mean 2 2.5 3 3.5 4 Frequency 1 2…
A: Answer:- Given table is
Q: Why is the answer 4.07? Please explain to me step by step. Thanks!
A: Answer:- Here, number of different brands (k) = 4 & Total number of observations (n) - 12 So,…
Q: An auditor has been assigned to take a peso-unit sample of a population of vouchers in the…
A: Given information: The total carrying amount is P300000, and the maximum misstatement is P900 with a…
Q: An insurance company offers four different deductible levels—none, low, medium, and high—for its…
A: Given , deductible levels for homeowner's policyholders - none(N), low(L), medium(M), and high(H)…
Q: A 23 factorial design was used to develop a nitride each process on a single-wafer plasma etching…
A: Given information: Design applied : 23 factorial design To calculate : Effect of AC factor
Q: Scene: The senior talent show is scheduled to take place this afternoon. Michael Senatore is in…
A: As per our guidelines we are supposed to answer only 3 subparts of any questions so i am solving…
Q: Three cards are drawn in succession from a deck without replacement. Find the probability…
A: It is given that three cards are drawn in succession from a deck without replacement.
Q: The boxplot below shows salaries for Actuaries and CPAs. + 20 CPA Actuary 30 + 50 40 60 Salary…
A: We have given the following box-plot
Q: You measure 48 backpacks' weights, and find they have a mean weight of 67 ounces. Assume the…
A:
Q: Draw a Venn diagram to represent each of the following: a. AUB c. An (BUC) e. AnBnC b. (AUB) d.…
A:
Step by step
Solved in 4 steps
- Refer to the accompanying data display that results from a sample of airport data speeds in mbps . Complete parts (a) through (c). TInterval (13.046,22.15) x=17.598 Sx=16.01712719 n=50Refer to the accompanying data display that results from a sample of airport data speeds in Mbps. Complete parts (a) through (c) below. Tinterval (13.046,22.15) x=17.598 Sx=16.01712719 n=50Kaitlyn measures the upload speed in megabits per second of her home broadband internet connection during peak hours and off-peak hours. The results are provided in the accompanying table. Peak Off-Peak 5.83 5.14 6.05 6.80 7.14 6.98 3.54 5.77 5.45 7.27 5.90 6.62 5.81 6.19 4.82 6.08 6.37 6.59 4.65 5.58 5.30 7.41 6.48 6.26 5.96 6.37 5.79 6.31 6.84 6.55 5.06 4.95 5.61 7.03 6.45 6.77 Examine the results of Kaitlyn's test to determine the statements that compare the medians and interquartile ranges of the data sets to each other in terms of this situation. Select the two correct answers. The median upload speed during peak hours is 5.905 megabits per second, which is less than the median upload speed during off-peak hours, 7.005 megabits per second. The upload speeds during peak hours are slower on average compared to off-peak times. The median upload speed during peak hours is 6.37 megabits per second, which is greater than the median upload speed during…
- The following data pertain to x, the amount of fertil-izer (in pounds) that a farmer applies to his soil, and y, his yield of wheat (in bushels per acre): xy xy xy112 33 88 24 37 2792 28 44 17 23 972 38 132 36 77 3266 17 23 14 142 38112 35 57 25 37 1388 31 111 40 127 2342 8 69 29 88 31126 37 19 12 48 3772 32 103 27 61 2552 20 141 40 71 1428 17 77 26 113 26 Assuming that the data can be looked upon as a randomsample from a bivariate normal population, calculate rand test its significance at the 0.01 level of significance.Also, draw a scattergram of these paired data and judgewhether the assumption seems reasonable.The following data represent the concentration of dissolved organic carbon (mg/L) collected from 20 samples of organic soil. Assume that the population is normally distributed. Complete parts (a) through (c) on the right.STATE: How heavy a load (in pounds) is needed to pull apart pieces of Douglas fir 4 inches long and 1.5 inches square? Given are data from students doing a laboratory exercise. 33,190 31,860 32,590 26,520 33,280 32,320 33,020 32,030 30,460 32,700 23,040 30,930 32,720 33,650 32,340 24,050 30,170 31,300 28,730 31,920 We are willing to regard the wood pieces prepared for the lab session as an SRS of all similar pieces of Douglas fir. Engineers also commonly assume that characteristics of materials vary Normally. Suppose that the strength of pieces of wood like these follows a Normal distribution with standard deviation 3000 pounds. PLAN: We will estimate ? by giving a 98% confidence interval. SOLVE: Find the sample mean ?¯ . (Enter your answer rounded to the nearest whole number.) ?¯= Give a 98% confidence interval, [???,ℎ??ℎ] , for the mean load required to pull the wood apart. (Enter your answers rounded to the nearest whole number.) ???=…
- Find the weighted average of these values. Value Weight 2.002.00 75.0%75.0% 3.003.00 15.0%15.0% 4.004.00 10.0%10.0% weighted average:The owner of a new car conducts a series of six gas mileage tests and obtains the following results, expressed in miles per gallon: 3., 22.7, 21.4, 20.6, and 21.4. 20.9. Find the mode for these data.STATE: How heavy a load (in pounds) is needed to pull apart pieces of Douglas fir 44 inches long and 1.5 inches square? Given are data from students doing a laboratory exercise. 33,190 31,860 32,590 26,520 33,280 32,320 33,020 32,030 30,460 32,700 23,040 30,930 32,720 33,650 32,340 24,050 30,170 31,300 28,730 31,920 We are willing to regard the wood pieces prepared for the lab session as an SRS of all similar pieces of Douglas fir. Engineers also commonly assume that characteristics of materials vary Normally. Suppose that the strength of pieces of wood like these follows a Normal distribution with standard deviation 3000 pounds. PLAN: We will estimate μ by giving a 95% confidence interval. SOLVE: Find the sample mean x¯ . (Enter your answer rounded to the nearest whole number.) x¯= Give a 95% confidence interval, [low, high] , for the mean load required to pull the wood apart. (Enter your answers rounded to the nearest whole number.) low=…
- Construct a dot plot for the asphalt data.(In the article “Evaluation of Low-Temperature Properties of HMA Mixtures”, the following values of fracture stress (in megapascals) were measured for a sample of 24 mixtures of hot-mixed asphalt (HMA).30 75 79 80 80 105 126 138 149 179 179 191223 232 232 236 240 242 245 247 254 274 384 470STATE: How heavy a load (in pounds) is needed to pull apart pieces of Douglas fir 44 inches long and 1.51.5 inches square? Given are data from students doing a laboratory exercise. 33,190 31,860 32,590 26,520 33,280 32,320 33,020 32,030 30,460 32,700 23,040 30,930 32,720 33,650 32,340 24,050 30,170 31,300 28,730 31,920 To access the complete data set, click the link for your preferred software format: Excel Minitab JMP SPSS TI R Mac-TXT PC-TXT CSV CrunchIt! We are willing to regard the wood pieces prepared for the lab session as an SRS of all similar pieces of Douglas fir. Engineers also commonly assume that characteristics of materials vary Normally. Suppose that the strength of pieces of wood like these follows a Normal distribution with standard deviation 3000 pounds. PLAN: We will estimate ?μ by giving a 98% confidence interval. SOLVE: Find the sample mean ?¯ . (Enter your answer rounded to the nearest whole number.) ?¯= Give a 98% confidence…Periodically, the county Water Department tests the drinking water of homeowners for contminants such as lead and copper. The lead and copper levels in water specimens collected in 1998 for a sample of 10 residents of a subdevelopement of the county are shown below. lead (μμg/L) copper (mg/L) 4.44.4 0.4840.484 2.72.7 0.0760.076 5.35.3 0.5950.595 3.33.3 0.1280.128 5.55.5 0.4690.469 1.71.7 0.4060.406 0.40.4 0.8480.848 0.70.7 0.0220.022 44 0.860.86 2.82.8 0.4250.425 (a) Construct a 99% confidence interval for the mean lead level in water specimans of the subdevelopment. blank≤μ≤blank (b) Construct a 99% confidence interval for the mean copper level in water specimans of the subdevelopment. blank≤μ≤blank