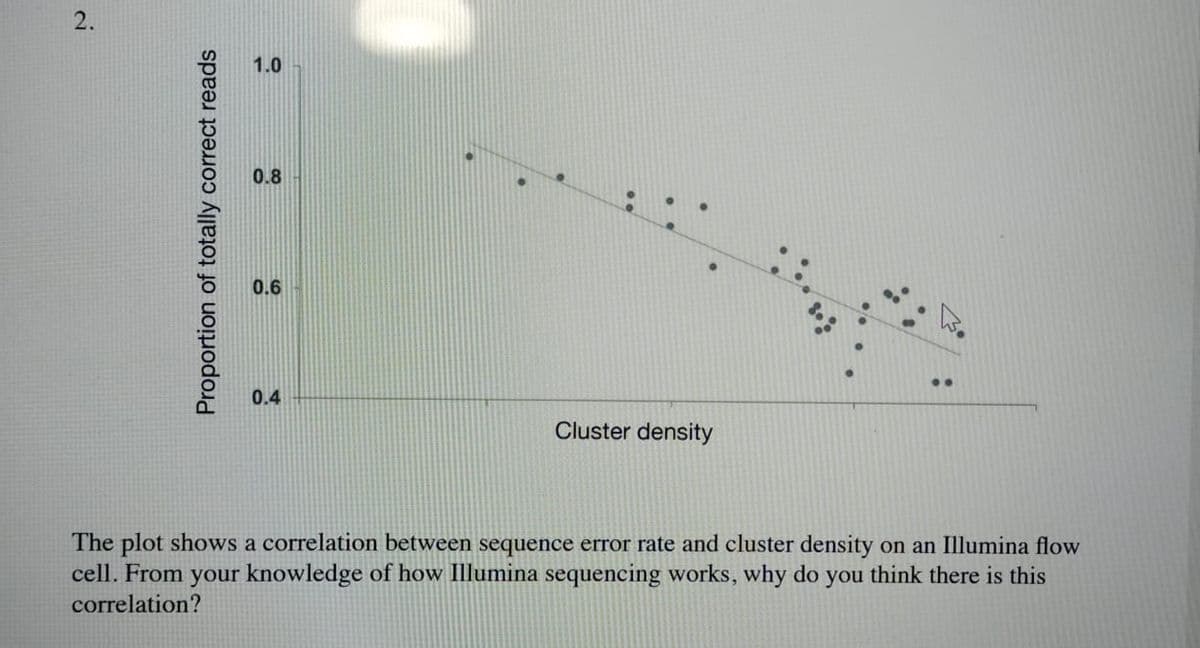
The plot shows a correlation between sequence error rate and cluster density on an Illumina flow cell. From your knowledge of how Illumina sequencing works, why do you think there is this correlation?
The plot shows a correlation between sequence error rate and cluster density on an Illumina flow cell. From your knowledge of how Illumina sequencing works, why do you think there is this correlation?
Biology 2e
2nd Edition
ISBN:9781947172517
Author:Matthew Douglas, Jung Choi, Mary Ann Clark
Publisher:Matthew Douglas, Jung Choi, Mary Ann Clark
Chapter14: Dna Structure And Function
Section: Chapter Questions
Problem 30CTQ: What are Okazaki fragments and how they are formed?
Related questions
Question
The plot shows a correlation between sequence error rate and cluster density on an Illumina flow cell. From your knowledge of how Illumina sequencing works, why do you think there is this correlation?

Transcribed Image Text:2.
Proportion of totally correct reads
1.0
0.8
0.6
0.4
Cluster density
The plot shows a correlation between sequence error rate and cluster density on an Illumina flow
cell. From your knowledge of how Illumina sequencing works, why do you think there is this
correlation?
Expert Solution
This question has been solved!
Explore an expertly crafted, step-by-step solution for a thorough understanding of key concepts.
Step by step
Solved in 3 steps with 1 images

Knowledge Booster
Learn more about
Need a deep-dive on the concept behind this application? Look no further. Learn more about this topic, biology and related others by exploring similar questions and additional content below.Recommended textbooks for you

Biology 2e
Biology
ISBN:
9781947172517
Author:
Matthew Douglas, Jung Choi, Mary Ann Clark
Publisher:
OpenStax

Biology 2e
Biology
ISBN:
9781947172517
Author:
Matthew Douglas, Jung Choi, Mary Ann Clark
Publisher:
OpenStax