The population of the United States (in million people) is given in the bar graph. Population of the United States 330 323.1 318.9 320 314.1 309.3 310 304.1 298.4 300 292.8 290 287.6 282.2 280 270 260 Year (a) Define variables for this problem. Identify which is the independent variable and which is the dependent variable. Adjust the data if needed. independent variable .--Select-- dependent variable .--Select-- (b) Create a scatterplot and draw an eyeball best-fit line through the data. 400- 380 360 340 320 300 280 260 240 220 O -2 2 4 6 8. 10 12 14 16 18 20 400 380 360 340 320 300 280 260 240 220 P 8 10 12 14 16 18 20 -2 2 4 6. Population (millions)
The population of the United States (in million people) is given in the bar graph. Population of the United States 330 323.1 318.9 320 314.1 309.3 310 304.1 298.4 300 292.8 290 287.6 282.2 280 270 260 Year (a) Define variables for this problem. Identify which is the independent variable and which is the dependent variable. Adjust the data if needed. independent variable .--Select-- dependent variable .--Select-- (b) Create a scatterplot and draw an eyeball best-fit line through the data. 400- 380 360 340 320 300 280 260 240 220 O -2 2 4 6 8. 10 12 14 16 18 20 400 380 360 340 320 300 280 260 240 220 P 8 10 12 14 16 18 20 -2 2 4 6. Population (millions)

Glencoe Algebra 1, Student Edition, 9780079039897, 0079039898, 2018
18th Edition
ISBN:9780079039897
Author:Carter
Publisher:Carter
Chapter4: Equations Of Linear Functions
Section4.5: Correlation And Causation
Problem 21PFA

Related questions
Topic Video
Question
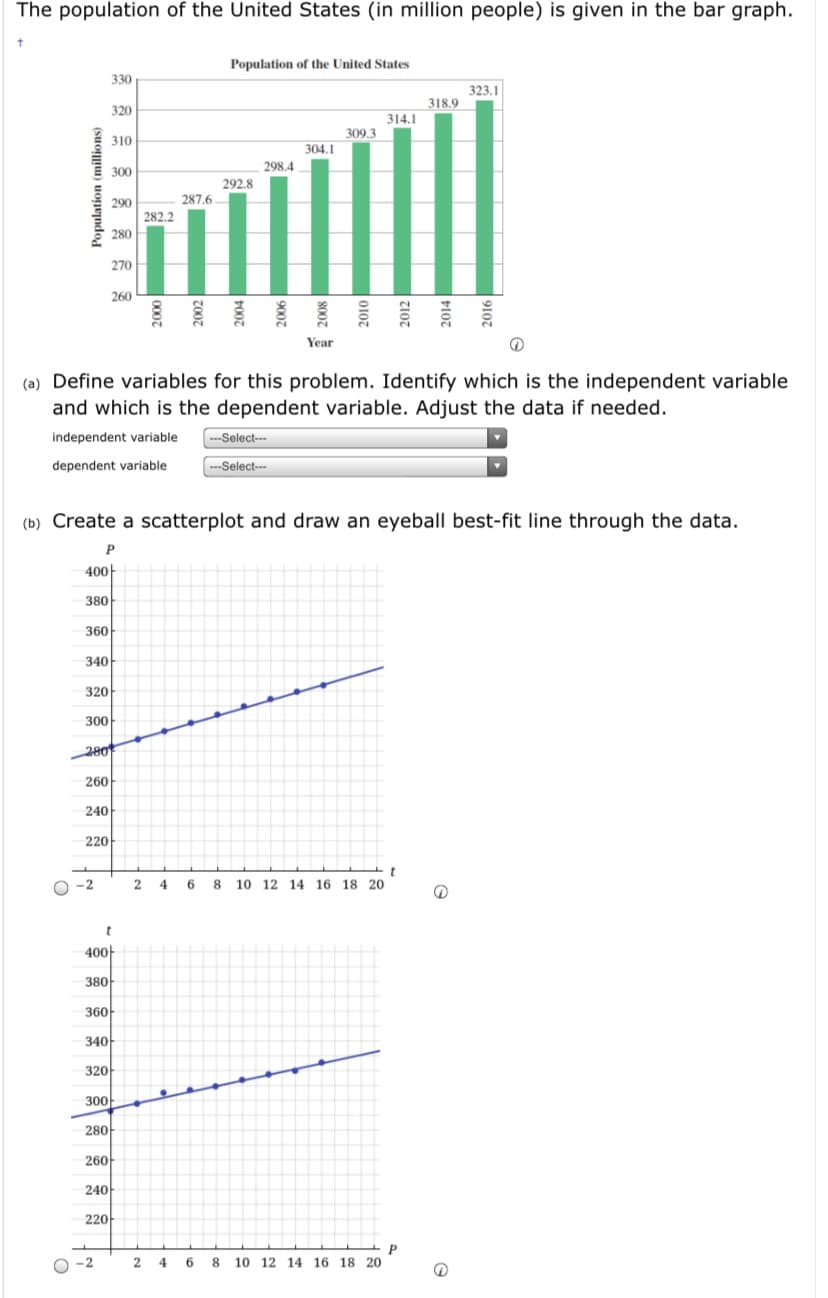
Transcribed Image Text:The population of the United States (in million people) is given in the bar graph.
Population of the United States
330
323.1
318.9
320
314.1
309.3
310
304.1
298.4
300
292.8
290
287.6
282.2
280
270
260
Year
(a) Define variables for this problem. Identify which is the independent variable
and which is the dependent variable. Adjust the data if needed.
independent variable
---Select---
dependent variable
---Select--
(b) Create a scatterplot and draw an eyeball best-fit line through the data.
P
400
380
360
340
320
300
280
260
240
220
O -2
2
4
6.
10 12 14 16 18 20
400
380
360
340
320
300
280
260
240
220
P
10 12 14 16 18 20
O -2
8.
Population (millions)
![400
380
360
340
320
300
280
260
240
220
P
10 12 14 16 18 20
O -2
4
8.
400-
380
360
340
320
300
280
260
240
220
O -2
4.
8 10 12 14 16 18 20
(c) What are a reasonable domain and range for your graphical model? Write
your answers using interval notation.
Domain:
O (200,400]
[-10, 10]
О го, 10]
O [275, 335]
O (-2, 19]
Range:
O [200,400]
[-10, 10]
О го, 10]
O (275, 335]
[-2, 19]
(d) Using your graphical model, estimate the population of the United States in
2017. (Round your answer to the nearest million people. Include units in
your answer. More information.)
(e) What is the vertical intercept for your model? (Round your answers to the
nearest whole number.)
(t, P) =
(1) What does the vertical intercept mean in terms of the population of the
United States? (Round your answer to the nearest million people. Include
units in your answer. More information.)
In the year 2000 there were approximately
in the United
States.](/v2/_next/image?url=https%3A%2F%2Fcontent.bartleby.com%2Fqna-images%2Fquestion%2F35c28fdb-7a6d-4bfc-bcea-3e5968caf59d%2F08e8544d-505e-4feb-9a66-d5bdc4a2a21f%2Fv0flbxo_processed.jpeg&w=3840&q=75)
Transcribed Image Text:400
380
360
340
320
300
280
260
240
220
P
10 12 14 16 18 20
O -2
4
8.
400-
380
360
340
320
300
280
260
240
220
O -2
4.
8 10 12 14 16 18 20
(c) What are a reasonable domain and range for your graphical model? Write
your answers using interval notation.
Domain:
O (200,400]
[-10, 10]
О го, 10]
O [275, 335]
O (-2, 19]
Range:
O [200,400]
[-10, 10]
О го, 10]
O (275, 335]
[-2, 19]
(d) Using your graphical model, estimate the population of the United States in
2017. (Round your answer to the nearest million people. Include units in
your answer. More information.)
(e) What is the vertical intercept for your model? (Round your answers to the
nearest whole number.)
(t, P) =
(1) What does the vertical intercept mean in terms of the population of the
United States? (Round your answer to the nearest million people. Include
units in your answer. More information.)
In the year 2000 there were approximately
in the United
States.
Expert Solution
This question has been solved!
Explore an expertly crafted, step-by-step solution for a thorough understanding of key concepts.

This is a popular solution!

Trending now
This is a popular solution!

Step by step
Solved in 5 steps with 1 images

Knowledge Booster


Learn more about
Need a deep-dive on the concept behind this application? Look no further. Learn more about this topic, algebra and related others by exploring similar questions and additional content below.Recommended textbooks for you
Glencoe Algebra 1, Student Edition, 9780079039897…
Algebra
ISBN:
9780079039897
Author:
Carter
Publisher:
McGraw Hill

Big Ideas Math A Bridge To Success Algebra 1: Stu…
Algebra
ISBN:
9781680331141
Author:
HOUGHTON MIFFLIN HARCOURT
Publisher:
Houghton Mifflin Harcourt

Linear Algebra: A Modern Introduction
Algebra
ISBN:
9781285463247
Author:
David Poole
Publisher:
Cengage Learning
Glencoe Algebra 1, Student Edition, 9780079039897…
Algebra
ISBN:
9780079039897
Author:
Carter
Publisher:
McGraw Hill
Big Ideas Math A Bridge To Success Algebra 1: Stu…
Algebra
ISBN:
9781680331141
Author:
HOUGHTON MIFFLIN HARCOURT
Publisher:
Houghton Mifflin Harcourt
Linear Algebra: A Modern Introduction
Algebra
ISBN:
9781285463247
Author:
David Poole
Publisher:
Cengage Learning

Functions and Change: A Modeling Approach to Coll…
Algebra
ISBN:
9781337111348
Author:
Bruce Crauder, Benny Evans, Alan Noell
Publisher:
Cengage Learning