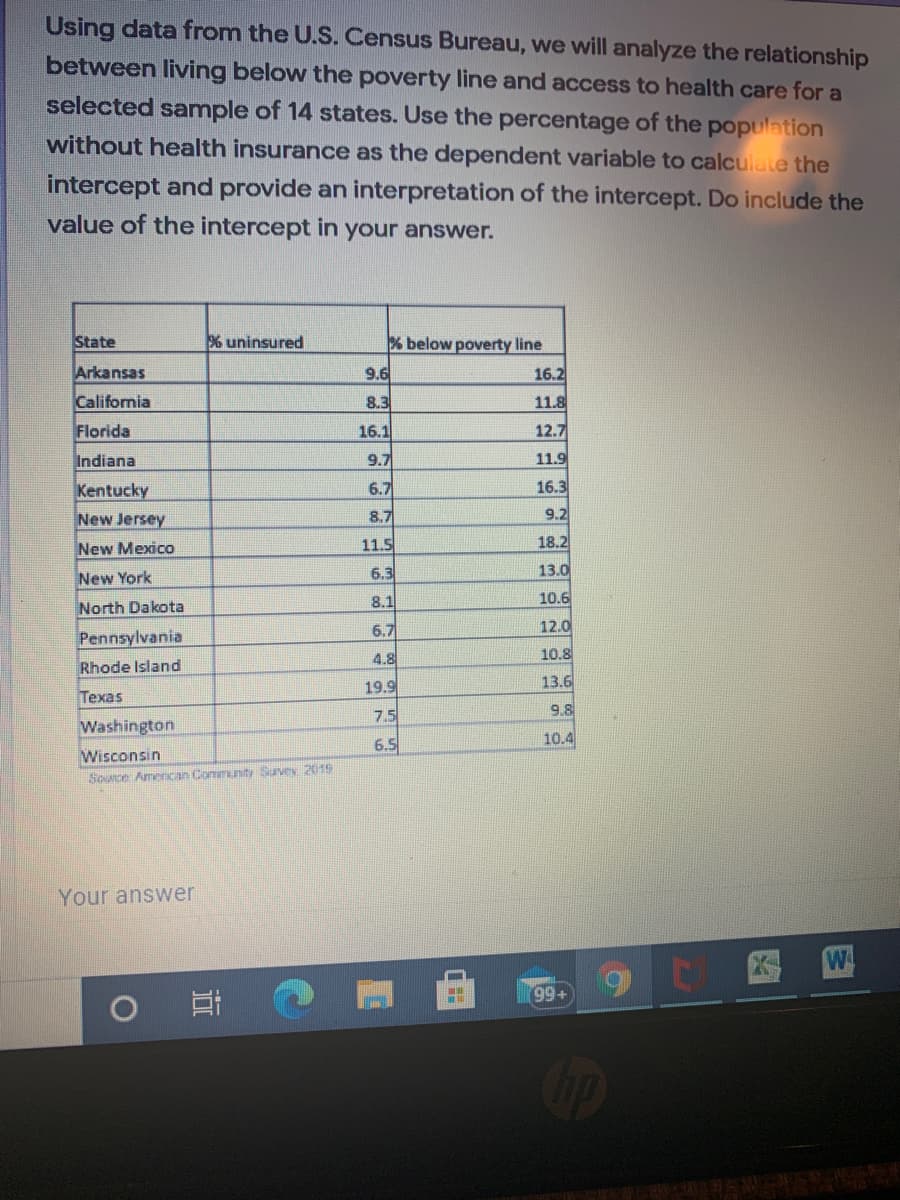
Using data from the U.S. Census Bureau, we will analyze the relationship between living below the poverty line and access to health care for a selected sample of 14 states. Use the percentage of the population without health insurance as the dependent variable to calculate the intercept and provide an interpretation of the intercept. Do include the value of the intercept in your answer. State 36 uninsured % below poverty line Arkansas 9.6 16.2 Califormia 8.3 11.8 Florida 16.1 12.7 Indiana 9.7 11.9 6.7 16.3 Kentucky New Jersey 8.7 9.2 New Mexico 11.5 18.2 New York 6.3 13.0 8.1 10.6 North Dakota Pennsylvania 6.7 12.0 4.8 10.8 Rhode Island 19.9 13.6 Texas 7.5 9.8 Washington 6.5 10.4 Wisconsin Source Amencan Community Survey 2019
Correlation
Correlation defines a relationship between two independent variables. It tells the degree to which variables move in relation to each other. When two sets of data are related to each other, there is a correlation between them.
Linear Correlation
A correlation is used to determine the relationships between numerical and categorical variables. In other words, it is an indicator of how things are connected to one another. The correlation analysis is the study of how variables are related.
Regression Analysis
Regression analysis is a statistical method in which it estimates the relationship between a dependent variable and one or more independent variable. In simple terms dependent variable is called as outcome variable and independent variable is called as predictors. Regression analysis is one of the methods to find the trends in data. The independent variable used in Regression analysis is named Predictor variable. It offers data of an associated dependent variable regarding a particular outcome.

Step by step
Solved in 2 steps with 2 images


