о3. (А) Phoenix Lumber Company uses the number of construction permits issued to help estimate demand (sales). The firm collected the following data on annual sales and number of construction permits issued in its market area: No. of Construction Year Permits Issued (000)1,000,000) Sales 2003 2004 2005 2006 2007 2008 2009 6.50 10.30 6.20 10.10 6.60 10.50 7.30 10.80 7.80 11.20 8.20 I1.40 8.30 11.30 a) Which variable is the dependent variable and which is the independent variable? bDetermine the estimated regression line. (e) Calculate the coefficient of determination. Give an economic interpretation to the value obtained.
о3. (А) Phoenix Lumber Company uses the number of construction permits issued to help estimate demand (sales). The firm collected the following data on annual sales and number of construction permits issued in its market area: No. of Construction Year Permits Issued (000)1,000,000) Sales 2003 2004 2005 2006 2007 2008 2009 6.50 10.30 6.20 10.10 6.60 10.50 7.30 10.80 7.80 11.20 8.20 I1.40 8.30 11.30 a) Which variable is the dependent variable and which is the independent variable? bDetermine the estimated regression line. (e) Calculate the coefficient of determination. Give an economic interpretation to the value obtained.
о3. (А) Phoenix Lumber Company uses the number of construction permits issued to help estimate demand (sales). The firm collected the following data on annual sales and number of construction permits issued in its market area: No. of Construction Year Permits Issued (000)1,000,000) Sales 2003 2004 2005 2006 2007 2008 2009 6.50 10.30 6.20 10.10 6.60 10.50 7.30 10.80 7.80 11.20 8.20 I1.40 8.30 11.30 a) Which variable is the dependent variable and which is the independent variable? bDetermine the estimated regression line. (e) Calculate the coefficient of determination. Give an economic interpretation to the value obtained.
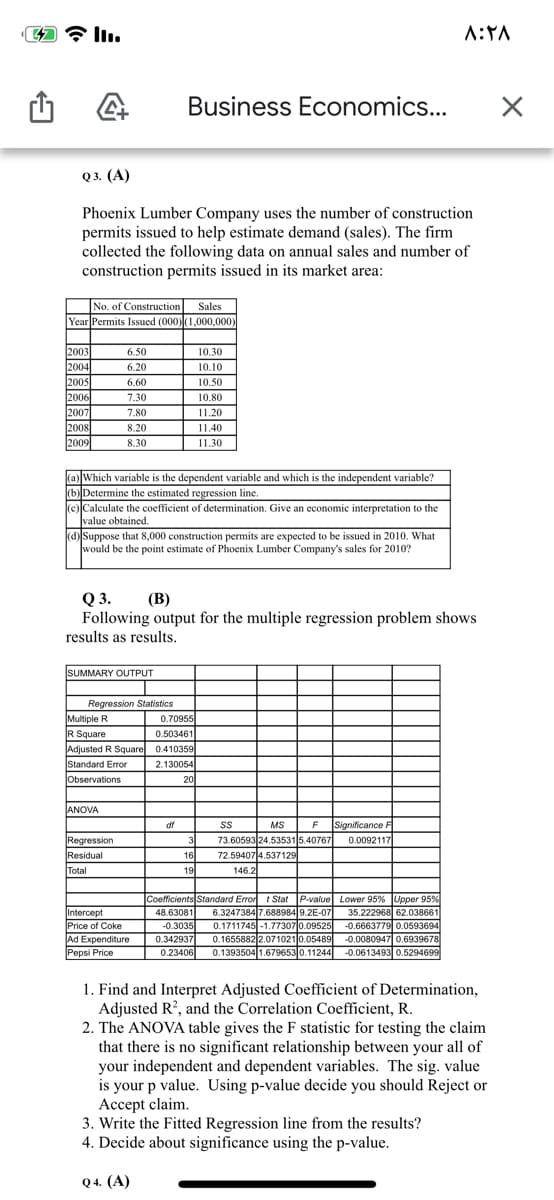
Phoenix Lumber Company uses the number of construction permits issued to help estimate demand (sales). The firm collected the following data on annual sales and number of construction permits issued in its market area:
No. of Construction
Sales
Year
Permits Issued (000)
(1,000,000)
2003
6.50
10.30
2004
6.20
10.10
2005
6.60
10.50
2006
7.30
10.80
2007
7.80
11.20
2008
8.20
11.40
2009
8.30
11.30
(a)
Which variable is the dependent variable and which is the independent variable?
(b)
Determine the estimated regression line.
(c)
Calculate the coefficient of determination. Give an economic interpretation to the value obtained.
(d)
Suppose that 8,000 construction permits are expected to be issued in 2010. What would be the point estimate of Phoenix Lumber Company's sales for 2010?
Q 3. (B)
Following output for the multiple regression problem shows results as results.
SUMMARY OUTPUT
Regression Statistics
Multiple R
0.70955
R Square
0.503461
Adjusted R Square
0.410359
Standard Error
2.130054
Observations
20
ANOVA
df
SS
MS
F
Significance F
Regression
3
73.60593
24.53531
5.40767
0.0092117
Residual
16
72.59407
4.537129
Total
19
146.2
Coefficients
Standard Error
t Stat
P-value
Lower 95%
Upper 95%
Intercept
48.63081
6.3247384
7.688984
9.2E-07
35.222968
62.038661
Price of Coke
-0.3035
0.1711745
-1.77307
0.09525
-0.6663779
0.0593694
Ad Expenditure
0.342937
0.1655882
2.071021
0.05489
-0.0080947
0.6939678
Pepsi Price
0.23406
0.1393504
1.679653
0.11244
-0.0613493
0.5294699
1. Find and Interpret Adjusted Coefficient of Determination, Adjusted R2, and the Correlation Coefficient, R.
2. The ANOVA table gives the F statistic for testing the claim that there is no significant relationship between your all of your independent and dependent variables. The sig. value is your p value. Using p-value decide you should Reject or Accept claim.
3. Write the Fitted Regression line from the results?
4. Decide about significance using the p-value.
Transcribed Image Text:Business Economics...
о3. (A)
Phoenix Lumber Company uses the number of construction
permits issued to help estimate demand (sales). The firm
collected the following data on annual sales and number of
construction permits issued in its market area:
No. of Construction Sales
Year Permits Issued (000)(1,000,000)
2003
2004
2005
2006
6.50
|10.30
6.20
10.10
6.60
10.50
7.30
10.80
2007
2008
2009
7.80
11.20
8.20
11.40
8.30
11.30
(a) Which variable is the dependent variable and which is the independent variable?
(b)Determine the estimated regression line.
(c) Calculate the coefficient of determination. Give an economic interpretation to the
value obtained.
(d) Suppose that 8,000 construction permits are expected to be issued in 2010. What
would be the point estimate of Phoenix Lumber Company's sales for 2010?
Q 3.
Following output for the multiple regression problem shows
(B)
results as results.
SUMMARY OUTPUT
Regression Statistics
0.70955
0.503461
Multiple R
R Square
Adjusted R Square 0.410359
Standard Error
Observations
2.130054
20
ANOVA
df
MS
F
Significance F
Regression
Residual
Total
73.60593 24.535315.40767
72.594074.537129
3
0.0092117
16
19
146.2
Coefficients Standard Error t Stat P-value Lower 95% Upper 95 %
6.3247384 7.688984 9.2E-07
0.1711745 -1.77307 0.09525
0.1655882 2.071021 0.05489
0.1393504 1.679653 0.11244
48.63081
Intercept
Price of Coke
Ad Expenditure
Pepsi Price
-0.3035
0.342937
0.23406
35.222968 62.038661
-0.6663779 0.0593694
-0.0080947 0.6939678
-0.0613493 0.5294699
1. Find and Interpret Adjusted Coefficient of Determination,
Adjusted R?, and the Correlation Coefficient, R.
2. The ANOVA table gives the F statistic for testing the claim
that there is no significant relationship between your all of
your independent and dependent variables. The sig. value
is your p value. Using p-value decide you should Reject or
Accept claim.
3. Write the Fitted Regression line from the results?
4. Decide about significance using the p-value.
Q 4. (A)
Definition Definition Relationship between two independent variables. A correlation tells the degree to which variables move in relation to each other. When two sets of data are related to each other, there is a correlation between them.
Expert Solution
This question has been solved!
Explore an expertly crafted, step-by-step solution for a thorough understanding of key concepts.
Need a deep-dive on the concept behind this application? Look no further. Learn more about this topic, statistics and related others by exploring similar questions and additional content below.