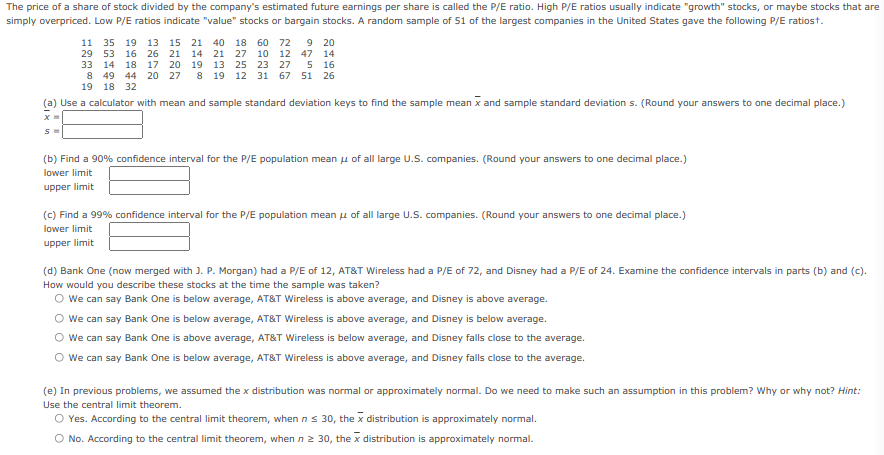
The price of a share of stock divided by the company's estimated future earnings per share is called the P/E ratio. High P/E ratios usually indicate "growth" stocks, or maybe stocks that simply overpriced. Low P/E ratios indicate "value" stocks or bargain stocks. A random sample of 51 of the largest companies in the United States gave the following P/E ratiost. 11 35 19 13 15 21 40 18 60 72 9 20 29 53 16 26 21 14 21 27 10 12 47 14 33 14 18 17 20 19 13 25 23 27 5 16 8 49 44 20 27 19 18 32 8 19 12 31 67 51 26 (a) Use a calculator with mean and sample standard deviation keys to find the sample mean x and sample standard deviation s. (Round your answers to one decimal place.) (b) Find a 90% confidence interval for the P/E population mean u of all large U.S. companies. (Round your answers to one decimal place.) lower limit upper limit (c) Find a 99% confidence interval for the P/E population mean u of all large U.S. companies. (Round your answers to one decimal place.) lower limit: upper limit

Glencoe Algebra 1, Student Edition, 9780079039897, 0079039898, 2018
18th Edition
ISBN:9780079039897
Author:Carter
Publisher:Carter
Chapter10: Statistics
Section10.6: Summarizing Categorical Data
Problem 10CYU
icon
Related questions
icon
Concept explainers
Topic Video
Question
The price of a share of stock divided by the company's estimated future earnings per share is called the P/E ratio. High P/E ratios usually indicate "growth" stocks, or maybe stocks that are
simply overpriced. Low P/E ratios indicate "value" stocks or bargain stocks. A random sample of 51 of the largest companies in the United States gave the following P/E ratiost.
9 20
11 35 19 13 15 21
29 53 16 26 21 14 21 27 10 12 47 14
40 18 60 72
33 14
8 49
5 16
8 19 12 31 67 51 26
18 17 20 19 13 25 23 27
44 20 27
19 18 32
(a) Use a calculator with mean and sample standard deviation keys to find the sample mean x and sample standard deviation s. (Round your answers to one decimal place.)
(b) Find a 90% confidence interval for the P/E population mean u of all large U.S. companies. (Round your answers to one decimal place.)
lower limit
upper limit
(c) Find a 99% confidence interval for the P/E population mean u of all large U.S. companies. (Round your answers to one decimal place.)
lower limit
upper limit
(d) Bank One (now merged with J. P. Morgan) had a P/E of 12, AT&T Wireless had a P/E of 72, and Disney had a P/E of 24. Examine the confidence intervals in parts (b) and (c).
How would you describe these stocks at the time the sample was taken?
We can say Bank One is below average, AT&T Wireless is above average, and Disney is above average.
We can say Bank One is below average, AT&T Wireless is above average, and Disney is below average.
O We can say Bank One is above average, AT&T Wireless is below average, and Disney falls close to the average.
O We can say Bank One is below average, AT&T Wireless is above average, and Disney falls close to the average.
(e) In previous problems, we assumed the x distribution was normal or approximately normal. Do we need to make such an assumption in this problem? Why or why not? Hint:
Use the central limit theorem.
O Yes. According to the central limit theorem, when ns 30, the x distribution is approximately normal.
O No. According to the central limit theorem, when n 2 30, the x distribution is approximately normal.
Transcribed Image Text:The price of a share of stock divided by the company's estimated future earnings per share is called the P/E ratio. High P/E ratios usually indicate "growth" stocks, or maybe stocks that are simply overpriced. Low P/E ratios indicate "value" stocks or bargain stocks. A random sample of 51 of the largest companies in the United States gave the following P/E ratiost. 9 20 11 35 19 13 15 21 29 53 16 26 21 14 21 27 10 12 47 14 40 18 60 72 33 14 8 49 5 16 8 19 12 31 67 51 26 18 17 20 19 13 25 23 27 44 20 27 19 18 32 (a) Use a calculator with mean and sample standard deviation keys to find the sample mean x and sample standard deviation s. (Round your answers to one decimal place.) (b) Find a 90% confidence interval for the P/E population mean u of all large U.S. companies. (Round your answers to one decimal place.) lower limit upper limit (c) Find a 99% confidence interval for the P/E population mean u of all large U.S. companies. (Round your answers to one decimal place.) lower limit upper limit (d) Bank One (now merged with J. P. Morgan) had a P/E of 12, AT&T Wireless had a P/E of 72, and Disney had a P/E of 24. Examine the confidence intervals in parts (b) and (c). How would you describe these stocks at the time the sample was taken? We can say Bank One is below average, AT&T Wireless is above average, and Disney is above average. We can say Bank One is below average, AT&T Wireless is above average, and Disney is below average. O We can say Bank One is above average, AT&T Wireless is below average, and Disney falls close to the average. O We can say Bank One is below average, AT&T Wireless is above average, and Disney falls close to the average. (e) In previous problems, we assumed the x distribution was normal or approximately normal. Do we need to make such an assumption in this problem? Why or why not? Hint: Use the central limit theorem. O Yes. According to the central limit theorem, when ns 30, the x distribution is approximately normal. O No. According to the central limit theorem, when n 2 30, the x distribution is approximately normal.
Expert Solution
trending now

Trending now

This is a popular solution!

steps

Step by step

Solved in 2 steps with 3 images

Blurred answer
Knowledge Booster
Centre, Spread, and Shape of a Distribution
Learn more about
Need a deep-dive on the concept behind this application? Look no further. Learn more about this topic, statistics and related others by exploring similar questions and additional content below.
Recommended textbooks for you
Glencoe Algebra 1, Student Edition, 9780079039897…
Algebra
ISBN:
9780079039897
Author:
Carter
Publisher:
McGraw Hill