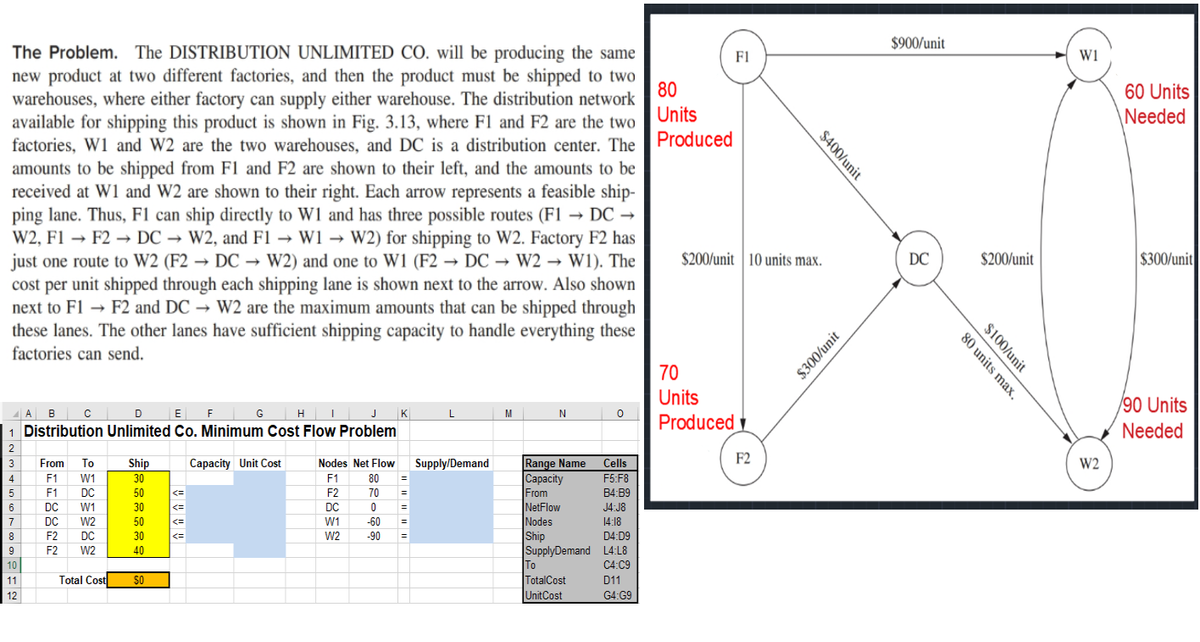
the Problem. The DISTRIBUTION UNLIMITED CO. will be producing the same new product at two different factories, and then the product must be shipped to two warehouses, where either factory can supply either warehouse. The distribution network available for shipping this product is shown in Fig. 3.13, where F1 and F2 are the two factories, W1 and W2 are the two warehouses, and DC is a distribution center. The amounts to be shipped from F1 and F2 are shown to their left, and the amounts to be received at W1 and W2 are shown to their right. Each arrow represents a feasible shipping lane. Thus, F1 can ship directly to W1 and has three possible routes (F1 → DC → W2, F1 → F2 → DC → W2, and F1 → W1 → W2) for shipping to W2. Factory F2 has just one route to W2 (F2 → DC → W2) and one to W1 (F2 → DC → W2 → W1). The cost per unit shipped through each shipping lane is shown next to the arrow. Also shown next to F1 → F2 and DC → W2 are the maximum amounts that can be shipped through these lanes. The other lanes have sufficient shipping capacity to handle everything these factories can send.   Included is an Excel sheet to help solve this linear programming problem. The factory units produced and the warehouse needs are expressed in red. Please explain how you arrive at your answer and are able to manipulate the simplex solver to accomplish this task as I am having trouble with it.
Practical Management Science
6th Edition
ISBN:9781337406659
Author:WINSTON, Wayne L.
Publisher:WINSTON, Wayne L.
Chapter5: Network Models
Section5.4: Other Logistics Models
Problem 20P
icon
Related questions
Question

the Problem. The DISTRIBUTION UNLIMITED CO. will be producing the same new product at two different factories, and then the product must be shipped to two warehouses, where either factory can supply either warehouse. The distribution network available for shipping this product is shown in Fig. 3.13, where F1 and F2 are the two factories, W1 and W2 are the two warehouses, and DC is a distribution center. The amounts to be shipped from F1 and F2 are shown to their left, and the amounts to be received at W1 and W2 are shown to their right. Each arrow represents a feasible shipping lane. Thus, F1 can ship directly to W1 and has three possible routes (F1 → DC → W2, F1 → F2 → DC → W2, and F1 → W1 → W2) for shipping to W2. Factory F2 has just one route to W2 (F2 → DC → W2) and one to W1 (F2 → DC → W2 → W1). The cost per unit shipped through each shipping lane is shown next to the arrow. Also shown next to F1 → F2 and DC → W2 are the maximum amounts that can be shipped through these lanes. The other lanes have sufficient shipping capacity to handle everything these factories can send.


Included is an Excel sheet to help solve this linear programming problem. The factory units produced and the warehouse needs are expressed in red. Please explain how you arrive at your answer and are able to manipulate the simplex solver to accomplish this task as I am having trouble with it.

The Problem. The DISTRIBUTION UNLIMITED CO. will be producing the same
new product at two different factories, and then the product must be shipped to two
warehouses, where either factory can supply either warehouse. The distribution network
available for shipping this product is shown in Fig. 3.13, where F1 and F2 are the two
factories, W1 and W2 are the two warehouses, and DC is a distribution center. The
amounts to be shipped from F1 and F2 are shown to their left, and the amounts to be
received at W1 and W2 are shown to their right. Each arrow represents a feasible ship-
ping lane. Thus, F1 can ship directly to W1 and has three possible routes (F1 → DC →
W2, F1 F2 → DC → W2, and F1 → W1 → W2) for shipping to W2. Factory F2 has
just one route to W2 (F2→ DC → W2) and one to W1 (F2→ DC → W2 → W1). The
cost per unit shipped through each shipping lane is shown next to the arrow. Also shown
next to F1 → F2 and DC → W2 are the maximum amounts that can be shipped through
these lanes. The other lanes have sufficient shipping capacity to handle everything these
factories can send.
2
3
4
5
6
7
8
9
10
11
12
A B C D E F G H I J K
Distribution Unlimited Co. Minimum Cost Flow Problem
Capacity Unit Cost
From
To
F1 W1
F1
DC
DC
F2
F2
DC
W1
W2
DC
W2
Total Cost
Ship
30
50
30
50
30
40
SO
슈슈슈슈
Nodes Net Flow
F1
F2
DC
80
70
0
W1
-60
W2 -90
Supply/Demand
M
N
Range Name
Capacity
From
NetFlow
Nodes
Ship
SupplyDemand
To
TotalCost
UnitCost
0
Cells
F5:F8
B4:B9
J4:J8
14:18
D4:D9
L4:L8
C4:C9
D11
G4 G9
80
Units
Produced
F1
70
Units
Produced
$200/unit 10 units max.
$400/unit
F2
$300/unit
$900/unit
DC
$200/unit
80 units max.
$100/unit
W1
W2
60 Units
Needed
$300/unit
/90 Units
Needed
Transcribed Image Text:The Problem. The DISTRIBUTION UNLIMITED CO. will be producing the same new product at two different factories, and then the product must be shipped to two warehouses, where either factory can supply either warehouse. The distribution network available for shipping this product is shown in Fig. 3.13, where F1 and F2 are the two factories, W1 and W2 are the two warehouses, and DC is a distribution center. The amounts to be shipped from F1 and F2 are shown to their left, and the amounts to be received at W1 and W2 are shown to their right. Each arrow represents a feasible ship- ping lane. Thus, F1 can ship directly to W1 and has three possible routes (F1 → DC → W2, F1 F2 → DC → W2, and F1 → W1 → W2) for shipping to W2. Factory F2 has just one route to W2 (F2→ DC → W2) and one to W1 (F2→ DC → W2 → W1). The cost per unit shipped through each shipping lane is shown next to the arrow. Also shown next to F1 → F2 and DC → W2 are the maximum amounts that can be shipped through these lanes. The other lanes have sufficient shipping capacity to handle everything these factories can send. 2 3 4 5 6 7 8 9 10 11 12 A B C D E F G H I J K Distribution Unlimited Co. Minimum Cost Flow Problem Capacity Unit Cost From To F1 W1 F1 DC DC F2 F2 DC W1 W2 DC W2 Total Cost Ship 30 50 30 50 30 40 SO 슈슈슈슈 Nodes Net Flow F1 F2 DC 80 70 0 W1 -60 W2 -90 Supply/Demand M N Range Name Capacity From NetFlow Nodes Ship SupplyDemand To TotalCost UnitCost 0 Cells F5:F8 B4:B9 J4:J8 14:18 D4:D9 L4:L8 C4:C9 D11 G4 G9 80 Units Produced F1 70 Units Produced $200/unit 10 units max. $400/unit F2 $300/unit $900/unit DC $200/unit 80 units max. $100/unit W1 W2 60 Units Needed $300/unit /90 Units Needed
Expert Solution
trending now

Trending now

This is a popular solution!

steps

Step by step

Solved in 5 steps with 2 images

Blurred answer
Similar questions
  • SEE MORE QUESTIONS
Recommended textbooks for you
Practical Management Science
Operations Management
ISBN:
9781337406659
Author:
WINSTON, Wayne L.
Publisher:
Cengage,