The quality control people at your company have tested a sample of 450 widgets and found that 23 were defective. What is your interval estimate (confidence interval) for the average propor- tion of defective widgets (choose your confidence level)?
The quality control people at your company have tested a sample of 450 widgets and found that 23 were defective. What is your interval estimate (confidence interval) for the average propor- tion of defective widgets (choose your confidence level)?

College Algebra (MindTap Course List)
12th Edition
ISBN:9781305652231
Author:R. David Gustafson, Jeff Hughes
Publisher:R. David Gustafson, Jeff Hughes
Chapter8: Sequences, Series, And Probability
Section8.7: Probability
Problem 58E: What is meant by the sample space of an experiment?

Related questions
Question
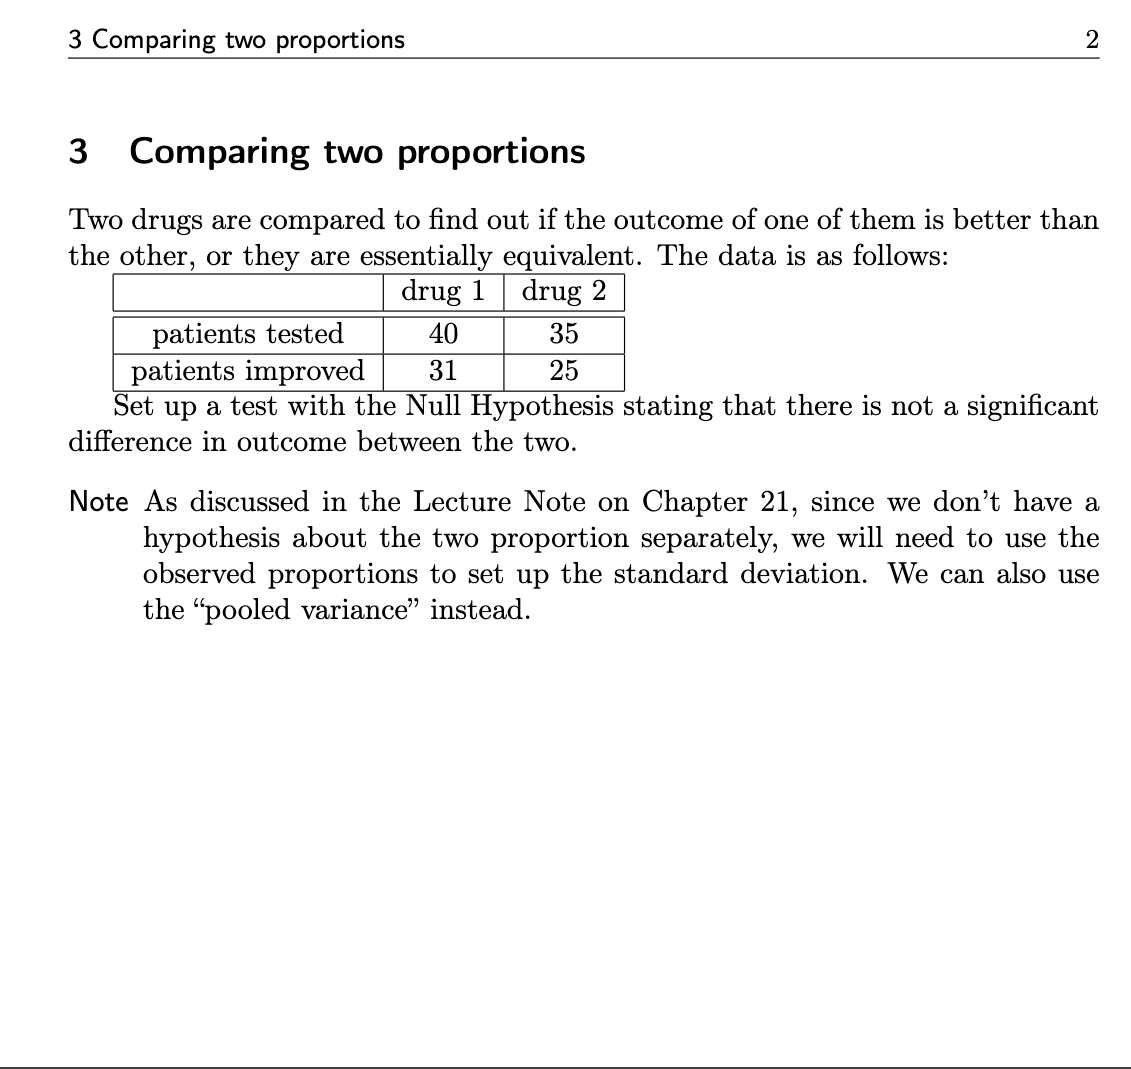
Transcribed Image Text:3 Comparing two proportions
2
3 Comparing two proportions
Two drugs are compared to find out if the outcome of one of them is better than
the other, or they are essentially equivalent. The data is as follows:
drug 1
drug 2
patients tested
40
patients improved
31
Set up a test with the Null Hypothesis stating that there is not a significant
difference in outcome between the two.
35
25
Note As discussed in the Lecture Note on Chapter 21, since we don't have a
hypothesis about the two proportion separately, we will need to use the
observed proportions to set up the standard deviation. We can also use
the "pooled variance" instead.
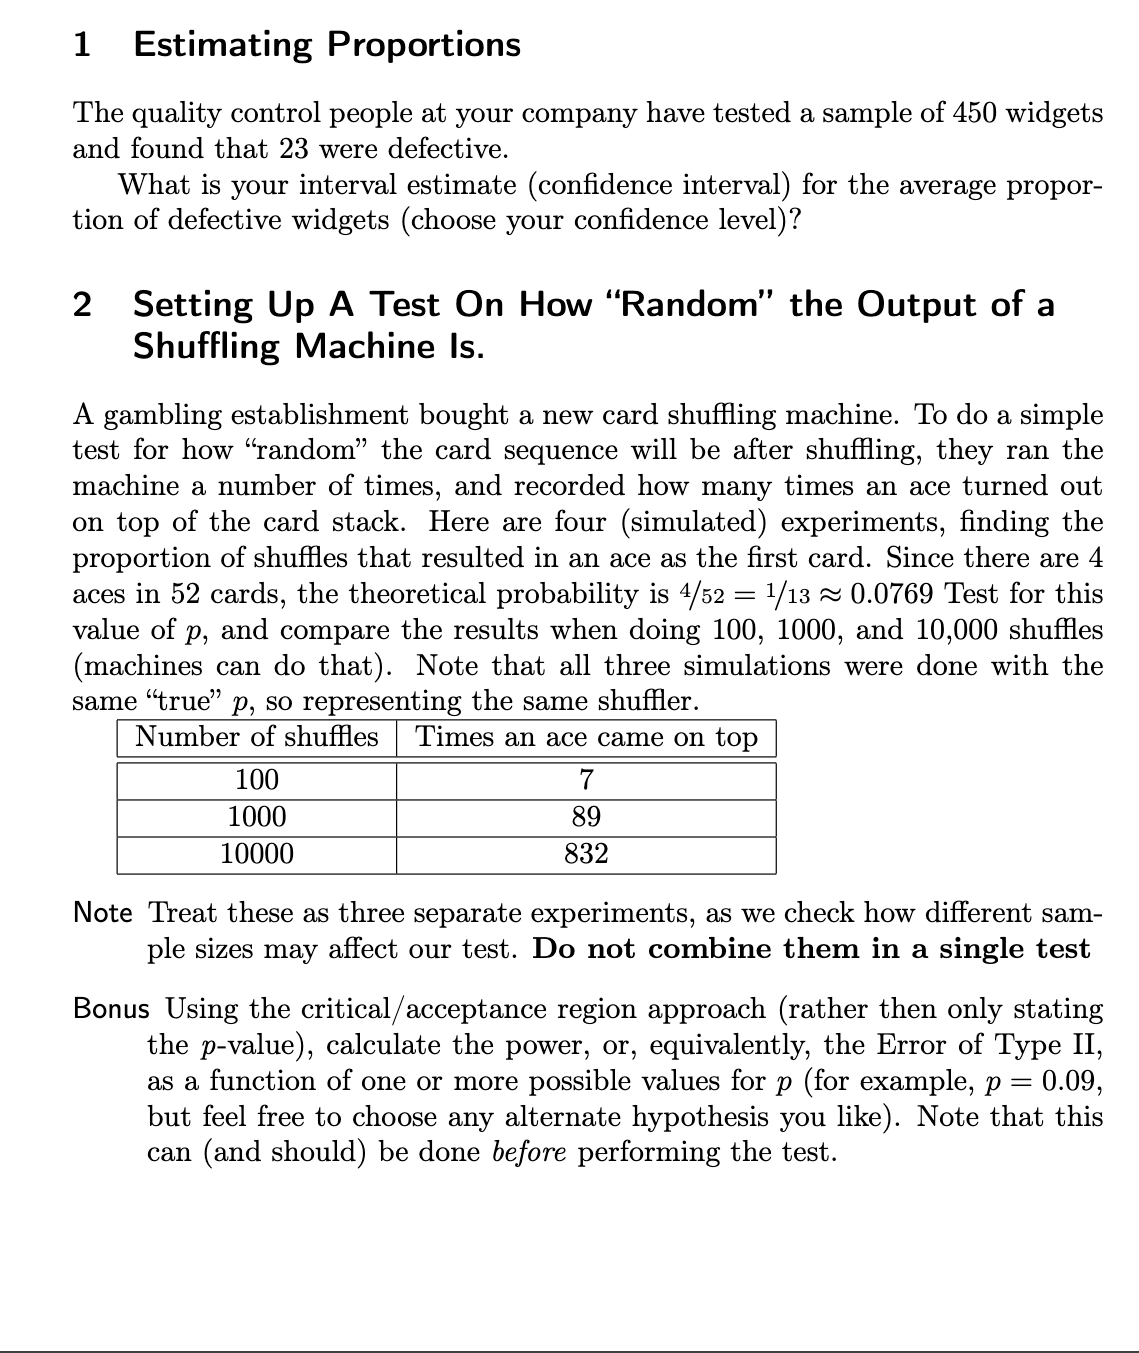
Transcribed Image Text:1 Estimating Proportions
The quality control people at your company have tested a sample of 450 widgets
and found that 23 were defective.
What is your interval estimate (confidence interval) for the average propor-
tion of defective widgets (choose your confidence level)?
2 Setting Up A Test On How "Random" the Output of a
Shuffling Machine Is.
A gambling establishment bought a new card shuffling machine. To do a simple
test for how "random” the card sequence will be after shuffling, they ran the
machine a number of times, and recorded how many times an ace turned out
on top of the card stack. Here are four (simulated) experiments, finding the
proportion of shuffles that resulted in an ace as the first card. Since there are 4
aces in 52 cards, the theoretical probability is 4/52 = ¹/13 ≈ 0.0769 Test for this
value of p, and compare the results when doing 100, 1000, and 10,000 shuffles
(machines can do that). Note that all three simulations were done with the
same "true" p, so representing the same shuffler.
Number of shuffles Times an ace came on top
100
1000
10000
7
89
832
Note Treat these as three separate experiments, as we check how different sam-
ple sizes may affect our test. Do not combine them in a single test
Bonus Using the critical/acceptance region approach (rather then only stating
the p-value), calculate the power, or, equivalently, the Error of Type II,
as a function of one or more possible values for p (for example, p = 0.09,
but feel free to choose any alternate hypothesis you like). Note that this
can (and should) be done before performing the test.
Expert Solution
This question has been solved!
Explore an expertly crafted, step-by-step solution for a thorough understanding of key concepts.

This is a popular solution!

Trending now
This is a popular solution!

Step by step
Solved in 3 steps

Recommended textbooks for you
College Algebra (MindTap Course List)
Algebra
ISBN:
9781305652231
Author:
R. David Gustafson, Jeff Hughes
Publisher:
Cengage Learning
College Algebra (MindTap Course List)
Algebra
ISBN:
9781305652231
Author:
R. David Gustafson, Jeff Hughes
Publisher:
Cengage Learning