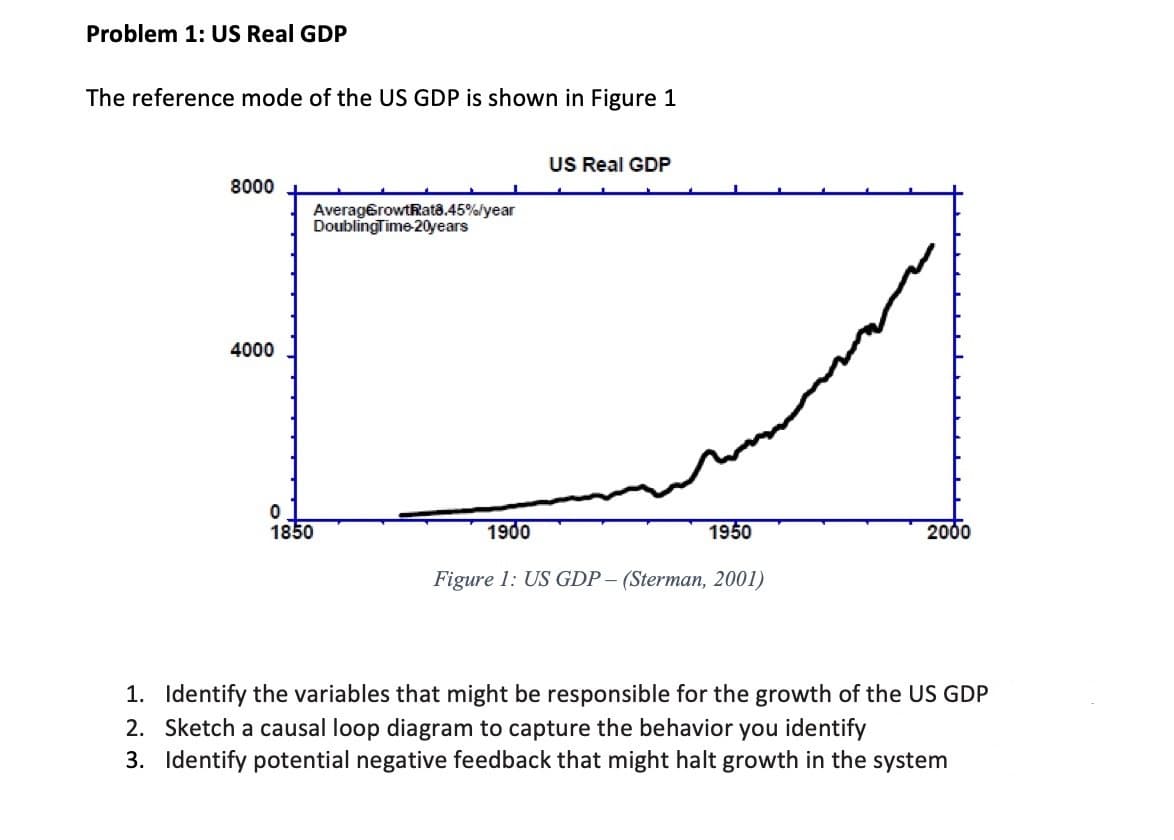
The reference mode of the US GDP is shown in Figure 1 US Real GDP 8000 AveragerowtRat8.45%lyear DoublingTime-20years 4000 1850 1900 1950 2000 Figure 1: US GDP - (Sterman, 2001) 1. Identify the variables that might be responsible for the growth of the US GDP 2. Sketch a causal loop diagram to capture the behavior you identify 3. Identify potential negative feedback that might halt growth in the system


Q: 1. Key facts about economic fluctuations The following graph approximates business cycles in…
A:
Q: 1.3 Read the following extract and answer questions 1.3-1.5. South Africa's economy grew by 1.1% in…
A: 1 - Option B Data Revision Due to changing the way GDP was being calculated by using the annualising…
Q: ased on the above information, fill out the following table. To calculate real GDP, assume 2011 is…
A: Formulas which we are going to use in this question: 1. Nominal GDP = Price of goods in current year…
Q: The following table shows the data for a hypothetical economy in a specific year. All figures are in…
A: GDP is the production of goods and services within a country at point of time here we calculate the…
Q: Canada’s real GDP in November 2020was $1,934,643,000 and $1,990.238,000 in November 2019. Canada’s…
A: Real GDP refers to the value of goods and services produced by a country and the value of goods is…
Q: Average labor productivity tends to be a coincident variable. Examine Figure 3.15 care- fully.…
A: A coincidental variable is used and analysed as it occurs. A coincidental variable is generally used…
Q: 2011 2012 $13.841 billion Nominal GDP Real GDP $13.195 blion $11.319 bilion $11.567 biion 1. the…
A: Nominal GDP is the market value of goods and services produced in an economy, unadjusted for…
Q: 1.3 Read the following extract and answer questions 1.3-1.5. South Africa’s economy grew by 1.1% in…
A: 1 - Option B Data Revision Annualizing method could be misleading during phases of economic…
Q: The following graph approximates business cycles in the United States from the first quarter of 1953…
A: Answer: (1). Notice that real GDP trends upward over time but experiences ups and downs in the…
Q: You are told in year 3, the real GDP is 4500. The growth in real GDP between year 2 and year 3 is…
A: Gross Domestic Product (GDP) is the total value of all the goods and services produced inside the…
Q: Calculate the Nominal GDP for: 2018 and 2019 .
A: Gross Domestic Product is the market value of all the domestically produced goods and services. It…
Q: eal-Time Data Analysis Exercise se the data in the following table to calculate the GDP deflator for…
A: The gross domestic product(GDP) refers to the market value of final commodities(goods and services)…
Q: Decide whether you would expect relationship between the following pairs of dependent and…
A: Investment: It refers to the amount of money divided by the people within their income. The…
Q: . Plot the GDP data in current and constant (i.e., 1992) dollars against time.
A: Since you have asked multiple question, we will solve the first question for you. If you want any…
Q: Cosider the following data on U.S GDP:a.What was the growth rate of nominal GDP between 1994 to…
A: Real GDP is the ratio of two variables namely nominal GDP to the GDP deflator and multiply by 100.…
Q: Consider an economy that producos and consumes only three goods. The following table shows the…
A: GDP growth rate is defined as the rate of increase in the GDP of a country during a period. The…
Q: Q no 16 Calculate U.S. GDP in 2009? Use the following data to work question 16 . The table lists…
A: Gross Domestic Product or GDP measures the market value of all the final goods and services produced…
Q: Exercise Number 1 Taking the data of the following table answer 1 through 3. Indicators of Puerto…
A: Answer: (1). Let us first find the personal disposable income at constant prices:Personal disposable…
Q: Gross Domestic Product (GDP) is one important indicator of economic well-being of an economy. The…
A: Hi Student, Thanks for posting the question. As per the guideline, we are providing answer for first…
Q: Real-Time Data Analysis Exercise The following table contains data for nominal GDP. real GDP, and…
A: The GDP (gross domestic product) price deflator estimates changes in the prices of all the goods and…
Q: 1. Which pair of percentages most accurately represents aggregate expenditure components of GDP…
A: Note:- Since we can only answer one question at a time, we'll answer the first one. Please repost…
Q: Household spending by all UK households amounted to over £500 billion in 1997, or 63% of gross…
A: 1.Environmental factors that can affect consumer durables are weather,pandemic,rain,natural…
Q: graph and label as either direct or indirect the relationships you would expect to find between a)…
A: (a.)The number of inches of rainfall per month and the sale of umbrellas:If inches of rainfall…
Q: Malaysian real GDP is substantially c era. Prior to the pandemic, the ccom However, due to the…
A: The real GDP measures the real value of the goods and services produced within a country during a…
Q: The table below showsa country's potential Gross Domestic Product (GDP) and true GDP Yeare 1970e…
A: (i) In order to plot the following points on the graphical region, we will need two axes with one…
Q: 2012 2013 Nominal GDP Real GDP $10,000 $12,000 9,500 10,500 Given the information above, calculate…
A: the GDP deflator is a measure of the level of prices of all new, domestically produced, final goods…
Q: which year the income shows a downward trend from the graph. Select one: a. 2016 b. 2018 c.…
A: Time series graph illustrates the data points at a consecutive time period.
Q: real GDP
A: Calculate the GDP for Q1 = C + I + G + NX = 300+70+170+30 =570
Q: Answer questions 12-13 based on the following data for a hypothetical economy. The base year for the…
A: An inflation rate measures the purchasing power that changes as the years pass by. Inflation can be…
Q: Explain/demonstrate period(s), since 2010, where the Jamaican economy experienced GDP Growth.…
A: Gross domestic product is the summation of all good and service produced in monetary value. and it…
Q: Consider the following data on the GDP of Z-product: a) What was real GDP in 2012 measured in 2008…
A: GDP deflator is the ratio of nominal gdp and real gdp .real gdp is the product of base year price…
Q: 1.3 Read the following extract and answer questions 1.3-1.5. South Africa’s economy grew by 1.1% in…
A: 1 - Option B By changing the way GDP was calculated, it could be misleading as annualising method…
Q: A country produces milk and butter, and it has published the following macroeconomic data. Year 1…
A: Real GDP is a measure of a country's gross domestic product that has been adjusted for inflation.…
Q: Plot the following Gross Domestic Product (GDP) data and specify the type of relationship (positive…
A: Gross Domestic Product (GDP) measures the total money value of all goods and services produced in an…
Q: The next four questions involve the following situation: Consider an economy with only three…
A: CPI refers to consumer price index. It is used to calculate inflation rate.
Q: Suppose production and prices of food and clothing (the only two…
A: We will answer the first question only. Please resubmit the other question separately in case you…
Q: 2. Table 1 shows the current GDP Data and real GDP for the year 2013 to 2015. Current GDP RM175…
A: year current GDP( bilion) true/right GDP(bilion) deflator inflation rate 2013 175 175 100 2014…
Q: The table contains price and quantity information for two vehicle models produced by Ford Motor…
A: Answer: Note: Please note that you have provided the same prices in 2017 for both models of the…
Q: 1. Calculate the values for the blanks in the shaded areas of the table below (identify your…
A: Export: It refers to the goods and services that a country sends to other nations. Export helps the…
Q: Real-Time Data Analysis Exercise The following table contains data for naminal GDP. real GDP. and…
A: Real GDP is an estimation of economic yield/output that represents the impacts of deflation or…
Q: Answer questions 12-13 based on the following data for a hypothetical economy. The base year for the…
A: GDP Deflator A indicator of inflation is the GDP deflator, also known as the implied price deflator.…
Q: Below is a hypothetical table such as would be generated by the Bureau of Labor Statistics when…
A: Gross Domestic Product is the sum of personal consumption expenditure, gross private domestic…
Q: Calculate per capita spending in 2010 and 2020, respectively, using constant dollars. *Results…
A: ---------------- 2010 2020 Total spending 89 104.12 Local GDP 110 134 Population 50000…
Q: Transcribed Image Text:The price and quantity data for Year 1 and Year 2 are as follows: Bread 50 1…
A: Gross Domestic Product is defined as the monetary value of all final goods and services produced…
Q: The following graph approximates business cycles in the United States from the first quarter of 1947…
A:

Step by step
Solved in 2 steps


- QUESTION TWOSuppose that the economy of Mwaliteta Republic has the following data for some economic variables. Assume that Mwaliteta Republic has a population of 500,000 people.Variable Amount in million ZMWExpenditure on Non-durable goods 98Non-residential fixed investment 79Central government expenditure 60Local government expenditure 82Expenditure on durable goods 82Expenditure on services 99Export expenditure 60Inventory Investment 5Depreciation 4Property income from abroad 12Indirect taxes 12Residential fixed investment 42Personal income tax…Please give a detailed solution with an explanation. Please double-check your sources and make sure the answer is 100% correct. Make sure ALL questions are answered too.Blank Answer #1:value of all goods and services produced in the economy in the base yearcost of a given market basket of goods and servicesvalue of all goods and services produced in the economy this yearBlank Answer #2:this year's pricesthe base year's pricesBlank Answer #3:value of all goods and services produced in the economy in the base yearcost of a given market basket of goods and servicesvalue of all goods and services produced in the economy this yearBlank Answer #4:this year's pricesthe base year's pricesBlank Answer #5:produced domesticallybought by consumersSuppose the data BELOW is for a given year from the annual Economic Report of the President. Calculate GDP using the expenditure approach (Amount in billions of dollars): Corporate profits: $ 305Depreciation: $ 479Gross private domestic investment: $716Personal taxes: $ 565Personal saving: $120Government spending: 924Imports: $ 547Exports: $ 427Personal consumption expenditures: $ 2,966Indirect business taxes: $ 370Contributions for Social Security (FICA): $ 394Transfer payments and other income: $ 967
- China’s real GDP increased 6.9 percent in the first quarter of 2017 from a year earlier.Investment grew by 9.2 percent and retail sales by 10.9 percent. In current prices, GDPincreased by 11.8 percent from a year earlier.1. Explain how China’s real GDP can grow at a 6.9 percent rate when consumption andinvestment grew faster than 6.9 percent. 2. Explain why the growth rate of GDP in current prices does not provide informationabout how quickly the economy is really growing.Consider the following NIPA data for 1Q2021 (First Quarter 20210 $ billlion) Investment: Non Residential $2,948.3 Exports $2,305.3 PCE Goods $5,183.5 Investment: Residential $1,043.7 Government Expendiures Federal $1,557.0 PCE Services $9,857.7 Imports $3,152.3 Governemnt Expenditures : State and local Goernent Expenditures $2,395.9 Change in private inventories -$90.1 1. Write the formula for GDP Compute the following: 2. Personal Consumption Expenditures (PCE): 3. Gross Private Domestic Investment (GPDI) 4. Net Exports (NX) 5. Government Expenditures (GOV) 6. GDPUse the following macroeconomic model structure to answer the questions followed. 8 pts C = 300 + 0.8Yd; C = consumption function; Yd (Y-T) = disposable income I = 200; I = Investment G = 400; G = Government expenditure T = 200; T = Tax revenue Also assume that Yf = Full employment GDP (Potential GDP) = 5,000 8.1. The equilibrium GDP level (income) is _________. Hint: Ye = C+I+G a. 2,850 b. 3,700 c. 3,145 d. 3,800 8.2. At the equilibrium level of output, the aggregate consumption level is: a. 3,100 b. 3,250 c. 3,400 d. 3,625 8.3. At the equilibrium level of output, the aggregate saving level is: a. 550 b. 450 c. 400 d. 350 8.4. The MPC and MPS for the economy is respectively: a. 0.9 and 0.1 b. 0.85 and 0.15 c. 0.75 and 0.25 d. 0.80 and 0.20
- T. Haavelmo devised a model of the US economy for the years 1929–1941 based on the followingequations:(i) c = 0.712y + 95.05 (ii) s = 0.158(c + x) − 34.30(iii) y = c + x − s (iv) x = 93.53Here x denotes total investment, y is disposable income, s is the total saving by firms, and c istotal consumption. Write the system of equations in the form (1) when the variables appear inthe order x, y, s, and c. Then find the solution of the system.Assume the following model of the economy: Y =C+I+G C = 120 + 0.5 (Y-T) I= 100 -10r G = 50 T=40 Identify each of the variables and briefly explain their meaning.Consumption $500Government Expenditures $200GNP $800Gross Private Domestic Investment $100Imports $100Exports $50 Questions: 3. Using the data above, PCE (Personal Consumption Expenditure) is equal to _____________.4. If the dollar amounts of the items above are the nominal amounts in year 2017, and the quantities of units are identical in years 2010 and 2017, but prices in 2010 were 20% less than 2017, Real GDP in 2017 using 2010 as the base year is equal to _______________.
- this question is for macroeconomics but on bartleby it just show economics Canada’s real GDP in November 2020was $1,934,643,000 and $1,990.238,000 in November 2019. Canada’s population was 37,593,384 in 2019 and 38,005238 in 2020. Complete the questions below, fully showing your calculations. (7 marks) A .What is the growth rate of real GDP from November 2019 to November 2020? B. What is the growth rate of real GDP per person? C. Explain what is happening to the Standard of Living in Canada from November 2019 to November 2020?Suppose an economy produces only 2 products that will also be used for directconsumption, as per the article at the end of the exam: chicken wings and donuts. Inthe second quarter of 2021 (the base period), 180,000 pounds of chicken wings wereproduced, at a value of $3.50 per pound, while in the second quarter of 2022,production of chicken wings increased to 200,000 pounds, at a value of $3.75 perpound. In the second quarter of 2021 (the base period), 85,000 donuts were producedat a value of $0.85 per donut, while in the second quarter of 2022, donut productionincreased to 100,000 donuts, each at a value of $0.95 per donut. The population inthis economy is 1000 individuals in 2022, while the number of hours worked in 2022is 5000. Also, the quantities that were produced in 2021 represent the quantities thatwere purchased by the typical household, meaning that everything that was producedwas sold.d. Solve for the amount of labor productivity in the second quarter of 2022.e. Solve for the…Gross Domestic Product (GDP) is one important indicator of economic well-beingof an economy. The following table shows expenditure components in the GDP ofa certain economy across three years (in billion dollars, 2018 chained values): 2017 2018 2019 Private Consumptions 1000 1100 1200 Private Investments 500 520 540 Government Spending 100 150 180 Exports 8500 9000 8600 Imports 8300 8800 8500 a. Compute the annual economic growth rates over the period. Describe how theeconomy changed over time. b. Briefly explain the changing sources of growth during the period. Brieflycomment on such changes. Adopt relevant calculations as appropriate. c. Briefly explain TWO limitations of relying on the above figures to indicate theeconomic well-being of the households in the economy .d. Refer to your answers in (c), suggest TWO additional macroeconomic indicatorsto accompany with the given figures in representing the changing economicwell-being. Briefly explain your choices.
