You are told in year 3, the real GDP is 4500. The growth in real GDP between year 2 and year 3 is ETTIT Quantity (Year 2) Quantity Product Price (Year 1) Price (Year 2) (Year 1) Cars 50 25 100 30 Homes 10 50 15 60 Cheeseburgers 100 150 Cheese 50 2 75 3 Select an answer and submit. For keyboard navigation, use the up/down arrow keys to select an answer. a 4.8% 12.5% C 7.8% d 15.0%
Q: 1. Given the following data, calculate the three-year moving averages for years 4 through 10.
A: A moving average is a method to find out about the patterns in an informational index; it is a…
Q: QI: A college student has purchased some shares in a company so that the profits are according to…
A: We are taking years as x0,x1,x2 and x3 and Profits are f(x0),f(x1),f(x2) and f(x3) respectively.…
Q: Variable Parameter Estimates Standard error Constant -164.0 20.24 Price of good X (P.) Price of good…
A:
Q: The diagram plots GDP per worker vs. capital per worker, both across countries in 1990 (the scatter…
A: Given that;
Q: An economist predicts that the cost of food will increase by 4% per year for the next several years.…
A: * SOLUTION :- (5) From the given information the answer is provided as below as ,
Q: India’s GDP per capita increased from $310 in 1991 to $1,489 in 2012. (i) Calculate the average…
A:
Q: Prepare a table and line graph showing the economic growth rate for st. Lucia and Germany for the…
A: Tabular presentation of economic growth of Germany and St. Lucia:- Year Germany St. Lucia 2016…
Q: You are given the following information about an economy, use the information to calculate exercises…
A: Answer: $270 Million
Q: The investment multipier is 2 of the country now find the value of MPC.
A: Given, Investement multiplier (K) = 2 Find the value of MPC.
Q: Solve the following system of equations for z and for y: System of Equations: Value of Value of y z…
A: (Since you have asked multiple questions, we will solve the first question for you. If you want any…
Q: 12. In 2018, a small town in South America had a population of 1,400 people. Upon recounting in…
A: Exponential growth is a process that increases quantity over time. It occurs when the instantaneous…
Q: Construct a suitable productivity index with base 2010 from the following information and also…
A: Need to find- Productivity index with 2010 as base Given in the question- The productivity index…
Q: The table below shows hypothetical data for volumes of e-books and hardcover books sold over a…
A: Given: Hardcover books: Year 1=72000 Year 2=59000 Year 3=31000
Q: Question 4: The following data represent the distribution of temperature in (ºC) of one city during…
A: From the given set of data, the frequency distribution table is computed below:
Q: i GDP & Years GDP 164000 160,000 156000 152000 1,48,000 144,000 GDP 2016 17 18 19 20 Years Note: The…
A: (GDP)Gross Domestic Product The total monetary or market worth of all the finished goods and…
Q: An automobile tire manufacturer collected the data in the table relating tire pressure x (in pounds…
A: Answer: Given, x Mileage f(x) 28 43 44 30 51 51.9 32 56 55.1 34 50 53.5 36 47 47.3…
Q: Real-Time Data Analysis Exercise The following table contains data for nominal GDP. real GDP, and…
A: The GDP (gross domestic product) price deflator estimates changes in the prices of all the goods and…
Q: Solve the following equation for x, where x represents a real number. X3D0.56х — 1.32 X = (Type an…
A: Given equation: x=0.56x-1.32 Taking x terms to the left-hand side x-0.56x=-1.32
Q: Find f'(x). 4 f(x) = 2x° (x* - 2) f'(x) = D %3D
A: Given: fx=2x5x4-2
Q: The circulation C of a certain magazine as a function of time t is given by the formula…
A: Time period can be calculated by using the following function. Time period (t) is calculated by…
Q: A tax on gasoline is proposed in order to raise money for the pollution-control activities of…
A:
Q: Compute average annual growth rate (linear/simple) from the following time series data on production…
A:
Q: 2) Solve the following equations for X without using logarithms Za) 22x = 16 - 27 *-X - 2 2 2c) In
A: 2a) 22x=16 16 can be written in exponent form with base 2 : 24 22x=24 One of the rule of exponents…
Q: Suppose the relationship between the government's tax revenue (T) and national income (Y) is…
A: Given T=30+0.5Y so here slope is 0.5 we can draw the graph of the equation which are as follow-
Q: Economics gretl: graph 1 0.8 0.6 0.4 0.2 0 -0.2 -0.4 -0.6 -0.8 T y = x 08 Q-Q plot for uhat1 1 -1 -1…
A: The qq plot also known as the quantile quantile plot helps us to determine the distribution of the…
Q: Instructions: Modify values in the SETTINGS window of the interactive tool to answer the questions…
A: * SOLUTION :- From the given information the answer is provided as below
Q: The forecast with out seasonality is modeled as: Sales 6 t+ 236.00, where t= time in months,…
A: Seasonality refers to a pattern which is repetitive in a time series data. It repeats over a period…
Q: You are given the actual sales volume for iPod, what used to be one of Apple’s popular electronic…
A: From introduction to termination, the product life-cycle explains the various stages that a product…
Q: The equation D(x) = 208(1.257)* represents the annual number of debit card transactions in Canada,…
A: We have given D(x)=2081.257x .... (1) Where D is in million and x is in years since…
Q: Suppose you have an extra six months of data on demands and prices, in addition to the data in the…
A: Given:
Q: The accompanying data table show the percentage of tax returns filed electronically in a city from…
A: Given data,
Q: 1- Indicate if the following data sets represent time-series, cross section or panel data . a-…
A: 1. Time series data is a sequence of data points indexed in time order. For example the population…
Q: Q4. Here is part of a calculation in a spreadsheet working with population data of x. Which…
A: Median: - it is a measure of central tendency which shows the exact middle value of the observations…
Q: Annual revenue for Corning Supplies grew by 5.5% in 2014; 1.1% in 2015; –3.5% in 2016; –1.1% in…
A: Hey champ,Welcome to this platform. Here you will get the answer with better quality in minimum…
Q: practise papers will be on time series and forecasting. You will use quarterly (GDP, GDP deflator)…
A: GDP GDP stands for the Gross domestic product, it is an economic element that is used to measure…
Q: low. You will need to use a calculator or Excel. Real GDP quantity index, base year 1915 equals_100…
A: The value of all goods and services generated by an economy in a given year is reflected in the real…
Q: $1,900 D $1,000; $1,000 $1,200: $1,000 $1,000; $1,200 $1,000 $1,800 g the data given in the table…
A: WHAT IS GDP DEFLATOR? GDP Deflator is also called as GDP Price Deflator or Implicit Price Deflator.…
Q: Greenhouse gases trap heat and make the planet warmer. Human activities are responsible for almost…
A: The measure that depicts different slices for illustration of a numerical proportion of various…
Q: geometric mean? (Be sure to go out at least 4 decimal places.)
A: The ‘geometric mean[GM]’ is the ‘average value’ that signifies the ‘central tendency’ of the set of…
Q: Give an analysis of Elephant Chart by Branko Milanovic.
A: The Elephant Curve, also known as the Lakner-Milanovic graph or the global growth incidence curve,…
Q: Determine the national LDV gasoline consumption using ASIF method! Please use following data to…
A: ASIF represents the factors of a conventional condition to compute the GHG discharges of transport…
Q: U.S. Population The projected population of theUnited States for selected years from 2000 to 2060…
A: The data depicts the facts or statistical data collected by analyzing the situation. The data can be…
Q: Below is a hypothetical table such as would be generated by the Bureau of Labor Statistics when…
A: Gross Domestic Product is the sum of personal consumption expenditure, gross private domestic…
Q: 1 The UK GDP per capita measures: Select one or more: a. the total output of London’s economy. b.…
A: We will answer the first question since the exact one was not specified. Please submit a new…
Q: From the following data relating to the number of letters posted a port office find the seasonal…
A: In the mentioned question we have to calculate seasonal variations using the method of simple…
Q: A country's growth rate (the percentage change in output) between 2000 and 2002 was 11%, and the…
A: Growth rate of an economy refers to a percentage increase in output of goods and services produced…
Assume all of the cheese are used in the production of the cheeseburgers. Also assume that Year 1 is the base year.
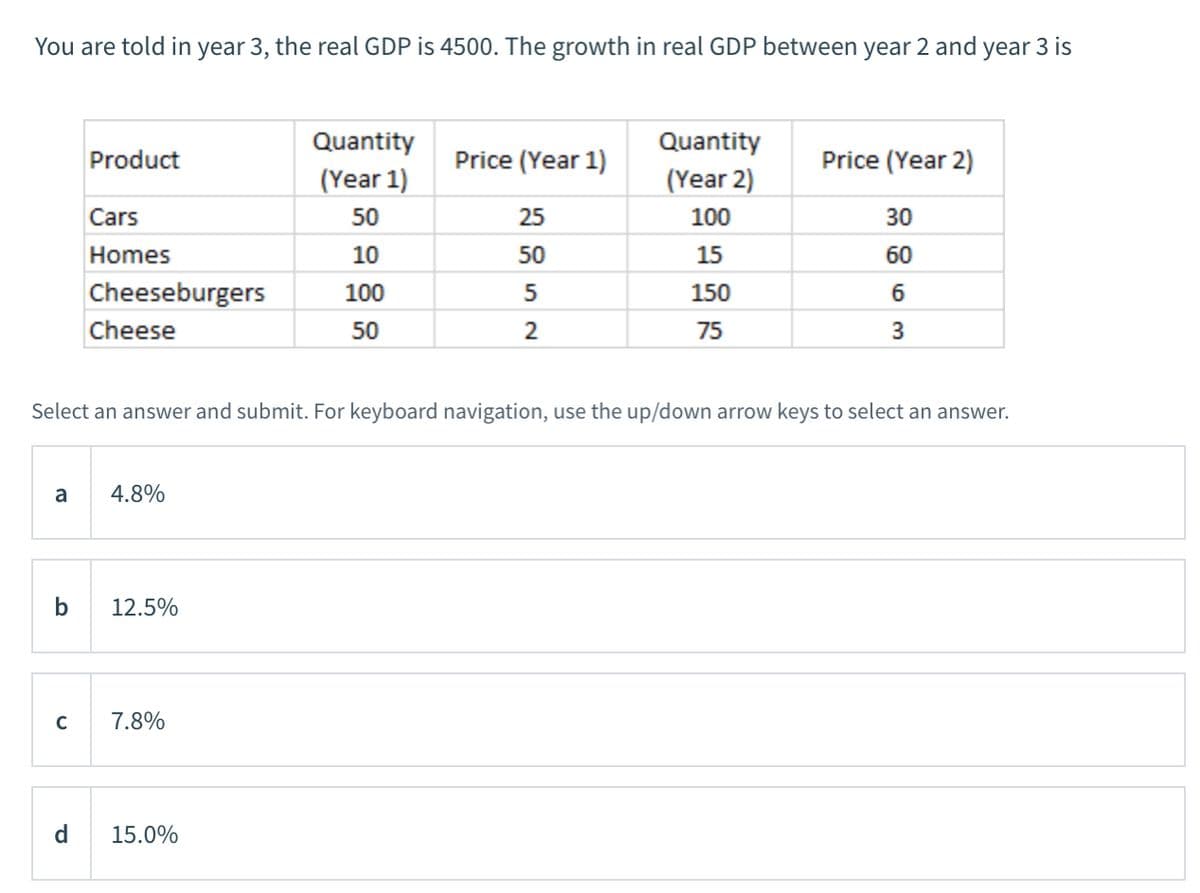
Trending now
This is a popular solution!
Step by step
Solved in 2 steps with 5 images
- Please provide a trend analysis for the GDP in Jamaica for the last 5 years and provide primary reasons for growth or decline. Please include stats to back up information provided2. The following table shows an example of gross domestic product values for five countriesfrom 2005 to 2010 in equivalent U.S. dollars ($). a. How could you improve the readability of this table?b. The file GdPyears contains sample data from the United Nations Statistics Divisionon 30 countries and their GDP values from 2005 to 2010 in U.S. dollars ($). Create atable that provides all these data for a user. Format the table to make it as easy to readas possible.practise papers will be on time series and forecasting. You will use quarterly (GDP, GDP deflator) or monthly data ( CPI, PPI, industrial production index) . Or some other data but it should have at least 100 observations. The topic is regarding about the effect of oil prices on GDP.
- Given below is the total Disposable Personal Income in Oman from 2010–2018. Draw a time series graph to show the analysis.Year Income (in 000s)2010- 50002011- 30002012 75002013- 80002014- 85002015 95002016 100002017 105002018 11000In which year the income shows a downward trend from the graph. Select one:a. 2016b. 2018c. 2015d. 2011Please no written by hand and no emage please help in summarising this data table into word form.Provide data on GDP of Iran from 2010 to 2019 to make a presentation like example,real GDp, trends in GDP, economic growth, recession.
- (1f) If Nominal GDP is $16,000 billion and the GDP deflator is 50, then Real GDP is: $25,000 billion. $32,000 billion. $8,000 billion. (1g) For productivity to increase the total number of hours worked has to increase. the value of the production per hour worked has to increase. the total production or output has to increase. (1a) The Helper Company’s customer service representatives received new computers and training on how to utilize them best. In regards to measuring productivity, these new computers and updated technology knowledge have increased profit for the Helper company. increased capital deepening for the Helper company. increased costs for the Helper company. (1b) Of the following examples, which one has little or no effect on labor productivity? The frequency of business cycles. (my guess) Technological change. The quality and quantity of available capital resources. (1c) What can you conclude when a nation’s production possibilities frontier shifts outward?…Use the data to calculate nominal Canadian GDP using the spending approach for both 2016 and 2017. 2016 (billions of $) 2017 (billions of $) Consumption $12,800 $13,300 Investment $3,200 $3,400 Exports $2,200 $2,400 Imports $2,700 $2,900 Government Spending $3,300 $3,400Year Cost of basket (R) of consumer goods / services Base Year 2018 1850 2019 2190 2020 2380 2021 2560 Use the information in Table 3-2 to measure the consumer price indexfor 2019, 2020 and 2021 respectively. Show your calculations and round off to two decimal places.
- Alex wants to measure the nominal 1998 GDP of $993 billion in 2008 dollars. From the data he gathered, he knows the deflator for 1998 is 30 and for 2008, it is 74, and that real interest in those years was 6.23% and 3.21% respectively. If he avoids making a misleading calculation, what will the value be?Year Waffles(Quantity) Waffles(Price) Orange Juice(Quantity) Orange Juice(Price) Toaster Ovens(Quantity) Toaster Ovens(Price) 2010 1000 $0.80 400 $4 280 $22 2011 1200 $0.90 410 $5 300 $25 2012 1500 $1 420 $6 300 $28 The above, like I said, is production data. Consumption data is as follows: the average citizen consumes 80 waffles, 20 units of orange juice and 10 toaster ovens. 2010 is the base year for all calculations. Carefully following all directions for entering your answer, tell me the cost (price) of the market basket for 2011. Carefully following all directions for entering your answer, calculate the inflation rate, using the CPI, for 2011-2012. Carefully following all directions for entering your answer, calculate the inflation rate, using the CPI, for 2011-2012. Carefully following all directions for entering your answer, calculate the GDP deflator for 2011 for this economy.Use the following composition of expenditure for the economy of a country named the Republic of Tapuwa, for the year ended 2019 to answer the questions below: Show all calculations and formulae Calculate the value of the country’s GDE (Gross Domestic Expenditure).