The relative frequency table below shows the waiting time, to the nearest minutes, of patients at the out-patient unit of a hospital. 13. Waiting time (min) 1 - 10 11 - 20 21 - 30 31 - 40 41 - 50 Relative frequency 0.06 0.20 0.28 0.32 0.14 Estimate the mean waiting time of the patients. Find the percentage of patients who have to wait longer than the mean waiting time.
The relative frequency table below shows the waiting time, to the nearest minutes, of patients at the out-patient unit of a hospital. 13. Waiting time (min) 1 - 10 11 - 20 21 - 30 31 - 40 41 - 50 Relative frequency 0.06 0.20 0.28 0.32 0.14 Estimate the mean waiting time of the patients. Find the percentage of patients who have to wait longer than the mean waiting time.

Glencoe Algebra 1, Student Edition, 9780079039897, 0079039898, 2018
18th Edition
ISBN:9780079039897
Author:Carter
Publisher:Carter
Chapter10: Statistics
Section: Chapter Questions
Problem 22SGR

Related questions
Question
100%
please help with this question, the answer is 28.3 and 52.16
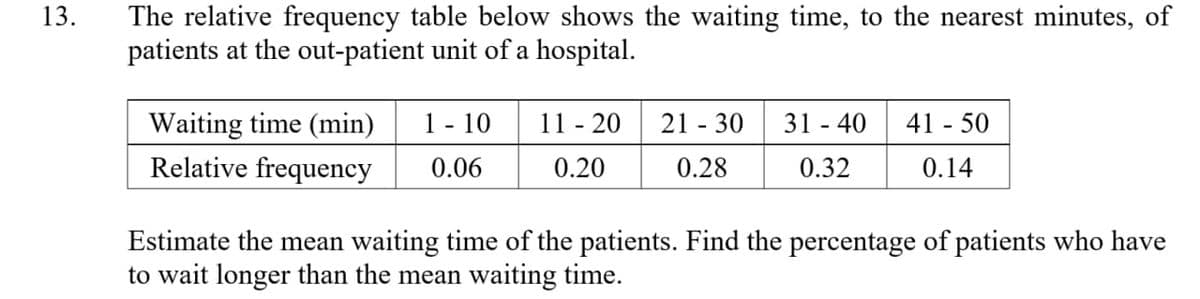
Transcribed Image Text:The relative frequency table below shows the waiting time, to the nearest minutes, of
patients at the out-patient unit of a hospital.
13.
Waiting time (min)
1 - 10
11 - 20
21 - 30
31 - 40 41 - 50
Relative frequency
0.06
0.20
0.28
0.32
0.14
Estimate the mean waiting time of the patients. Find the percentage of patients who have
to wait longer than the mean waiting time.
Expert Solution
This question has been solved!
Explore an expertly crafted, step-by-step solution for a thorough understanding of key concepts.

This is a popular solution!

Trending now
This is a popular solution!

Step by step
Solved in 2 steps with 4 images

Recommended textbooks for you
Glencoe Algebra 1, Student Edition, 9780079039897…
Algebra
ISBN:
9780079039897
Author:
Carter
Publisher:
McGraw Hill

Holt Mcdougal Larson Pre-algebra: Student Edition…
Algebra
ISBN:
9780547587776
Author:
HOLT MCDOUGAL
Publisher:
HOLT MCDOUGAL
Glencoe Algebra 1, Student Edition, 9780079039897…
Algebra
ISBN:
9780079039897
Author:
Carter
Publisher:
McGraw Hill
Holt Mcdougal Larson Pre-algebra: Student Edition…
Algebra
ISBN:
9780547587776
Author:
HOLT MCDOUGAL
Publisher:
HOLT MCDOUGAL