The results below are based on a sample of 20 employees selected to study the relationship between income (Y, in $1,000) and four variables: Age (X,, in years), work experience (X2, in years), number of years of education (X3), and number of past jobs (X4). Find the upper end point in a 98% confidence interval for the change in the mean salary in dollars, for a unit change in number of years of education, assuming that the other predictors remain unchanged. Note that normality is assumed for the multiple regression model. Standard Coeffcient Error -9.611198 2.77988638 Intercept Age Experience Educ 1.327695 0.1149193 -0.106705 0.14265559 7.311332 0.80324187 Pastlobs -0.504168 0.44771573 Answer:
The results below are based on a sample of 20 employees selected to study the relationship between income (Y, in $1,000) and four variables: Age (X,, in years), work experience (X2, in years), number of years of education (X3), and number of past jobs (X4). Find the upper end point in a 98% confidence interval for the change in the mean salary in dollars, for a unit change in number of years of education, assuming that the other predictors remain unchanged. Note that normality is assumed for the multiple regression model. Standard Coeffcient Error -9.611198 2.77988638 Intercept Age Experience Educ 1.327695 0.1149193 -0.106705 0.14265559 7.311332 0.80324187 Pastlobs -0.504168 0.44771573 Answer:

Glencoe Algebra 1, Student Edition, 9780079039897, 0079039898, 2018
18th Edition
ISBN:9780079039897
Author:Carter
Publisher:Carter
Chapter10: Statistics
Section10.4: Distributions Of Data
Problem 19PFA

Related questions
Question
4
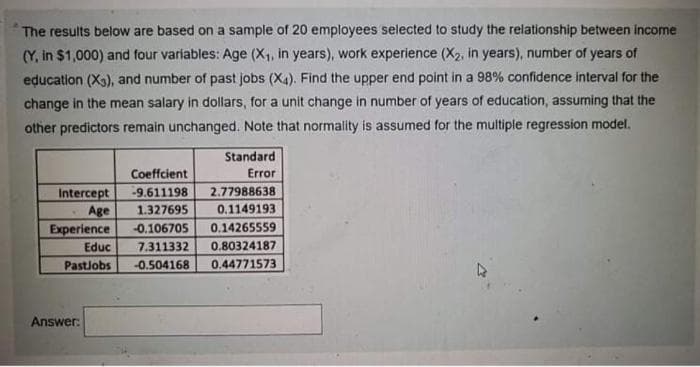
Transcribed Image Text:The results below are based on a sample of 20 employees selected to study the relationship between income
(Y, in $1,000) and four variables: Age (X1, in years), work experience (X2, in years), number of years of
education (X3), and number of past jobs (X4). Find the upper end point in a 98% confidence interval for the
change in the mean salary in dollars, for a unit change in number of years of education, assuming that the
other predictors remain unchanged. Note that normality is assumed for the multiple regression model.
Standard
Coeffcient
Error
2.77988638
Intercept
Age
Experience
-9.611198
1.327695
0.1149193
-0.106705
0.14265559
Educ
7.311332
0.80324187
Pastlobs
-0.504168
0.44771573
Answer:
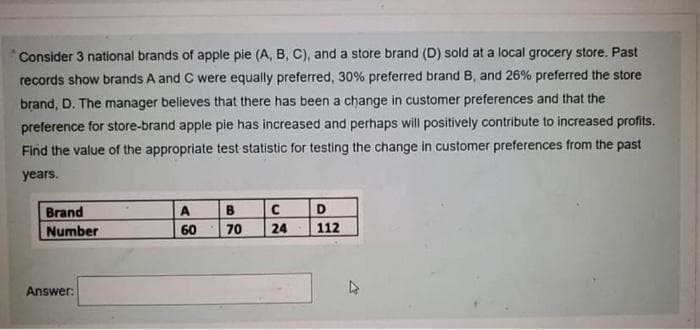
Transcribed Image Text:Consider 3 national brands of apple pie (A, B, C), and a store brand (D) sold at a local grocery store. Past
records show brands A and C were equally preferred, 30% preferred brand B, and 26% preferred the store
brand, D. The manager believes that there has been a change in customer preferences and that the
preference for store-brand apple pie has increased and perhaps will positively contribute to increased profits.
Find the value of the appropriate test statistic for testing the change in customer preferences from the past
years.
Brand
A
D
Number
60
70
24
112
Answer:
Expert Solution
This question has been solved!
Explore an expertly crafted, step-by-step solution for a thorough understanding of key concepts.

Step by step
Solved in 2 steps with 2 images

Recommended textbooks for you
Glencoe Algebra 1, Student Edition, 9780079039897…
Algebra
ISBN:
9780079039897
Author:
Carter
Publisher:
McGraw Hill
Glencoe Algebra 1, Student Edition, 9780079039897…
Algebra
ISBN:
9780079039897
Author:
Carter
Publisher:
McGraw Hill