The Runs The simulator should take 2 command-line arguments (or write a "simulator-run" function that takes 2 arguments, if command-line stuffs are too difficult to you): The first is the average arrival rate and the second is the average service time. We will vary the average arrival rate, λ, of processes from 10 processes per second to 30 processes per second with increment step of 1 (i.e., we are doing 21 simulation runs for 10, 11, λ = 12, ... λ=30, respectively). The service time is generated according to an Exponential Distribution with an average service time of 0.04 second. For each run, you would need to output the four itemized metrics above. The Plots The report would include a brief description of the results and show a single plot for each one of the above metrics (with 2 as the x-axis). That is, each plot would have 21 data point, and there are four plots (one for each metrics). A brief description and/or discussion on the interpretation of the plots should also be included.
The Runs The simulator should take 2 command-line arguments (or write a "simulator-run" function that takes 2 arguments, if command-line stuffs are too difficult to you): The first is the average arrival rate and the second is the average service time. We will vary the average arrival rate, λ, of processes from 10 processes per second to 30 processes per second with increment step of 1 (i.e., we are doing 21 simulation runs for 10, 11, λ = 12, ... λ=30, respectively). The service time is generated according to an Exponential Distribution with an average service time of 0.04 second. For each run, you would need to output the four itemized metrics above. The Plots The report would include a brief description of the results and show a single plot for each one of the above metrics (with 2 as the x-axis). That is, each plot would have 21 data point, and there are four plots (one for each metrics). A brief description and/or discussion on the interpretation of the plots should also be included.

Operations Research : Applications and Algorithms
4th Edition
ISBN:9780534380588
Author:Wayne L. Winston
Publisher:Wayne L. Winston
Chapter20: Queuing Theory
Section: Chapter Questions
Problem 17RP

Related questions
Question
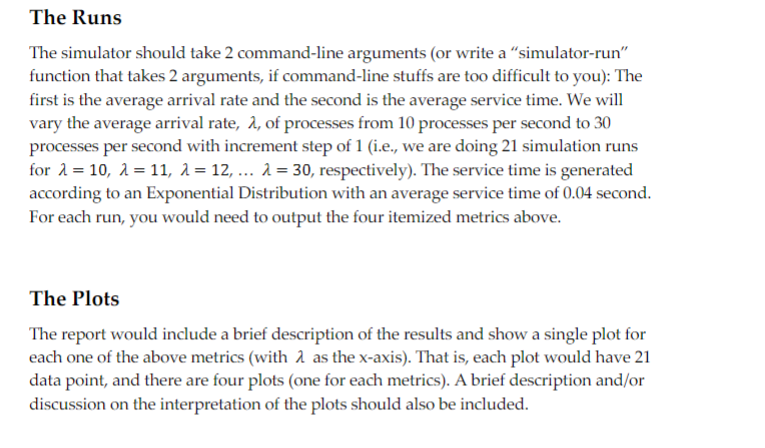
Transcribed Image Text:The Runs
The simulator should take 2 command-line arguments (or write a "simulator-run"
function that takes 2 arguments, if command-line stuffs are too difficult to you): The
first is the average arrival rate and the second is the average service time. We will
vary the average arrival rate, λ, of processes from 10 processes per second to 30
processes per second with increment step of 1 (i.e., we are doing 21 simulation runs
for 10, 11, λ = 12, ... λ=30, respectively). The service time is generated
according to an Exponential Distribution with an average service time of 0.04 second.
For each run, you would need to output the four itemized metrics above.
The Plots
The report would include a brief description of the results and show a single plot for
each one of the above metrics (with 2 as the x-axis). That is, each plot would have 21
data point, and there are four plots (one for each metrics). A brief description and/or
discussion on the interpretation of the plots should also be included.
Expert Solution
This question has been solved!
Explore an expertly crafted, step-by-step solution for a thorough understanding of key concepts.

This is a popular solution!

Trending now
This is a popular solution!

Step by step
Solved in 1 steps

Recommended textbooks for you
Operations Research : Applications and Algorithms
Computer Science
ISBN:
9780534380588
Author:
Wayne L. Winston
Publisher:
Brooks Cole

C++ Programming: From Problem Analysis to Program…
Computer Science
ISBN:
9781337102087
Author:
D. S. Malik
Publisher:
Cengage Learning

Programming Logic & Design Comprehensive
Computer Science
ISBN:
9781337669405
Author:
FARRELL
Publisher:
Cengage
Operations Research : Applications and Algorithms
Computer Science
ISBN:
9780534380588
Author:
Wayne L. Winston
Publisher:
Brooks Cole
C++ Programming: From Problem Analysis to Program…
Computer Science
ISBN:
9781337102087
Author:
D. S. Malik
Publisher:
Cengage Learning
Programming Logic & Design Comprehensive
Computer Science
ISBN:
9781337669405
Author:
FARRELL
Publisher:
Cengage

Microsoft Visual C#
Computer Science
ISBN:
9781337102100
Author:
Joyce, Farrell.
Publisher:
Cengage Learning,