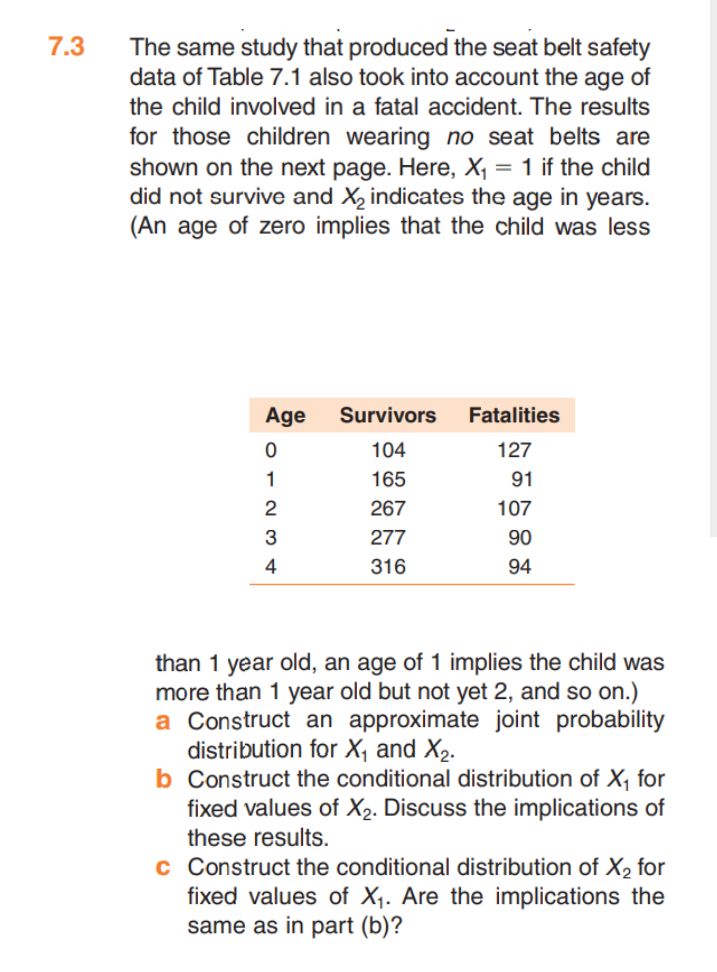
The same study that produced the seat belt safety data of Table 7.1 also took into account the age of the child involved in a fatal accident. The results for those children wearing no seat belts are shown on the next page. Here, X¡ = 1 if the child did not survive and X, indicates the age in years. (An age of zero implies that the child was less
The same study that produced the seat belt safety data of Table 7.1 also took into account the age of the child involved in a fatal accident. The results for those children wearing no seat belts are shown on the next page. Here, X¡ = 1 if the child did not survive and X, indicates the age in years. (An age of zero implies that the child was less

MATLAB: An Introduction with Applications
6th Edition
ISBN:9781119256830
Author:Amos Gilat
Publisher:Amos Gilat
Chapter1: Starting With Matlab
Section: Chapter Questions
Problem 1P

Related questions
Question
Transcribed Image Text:7.3
The same study that produced the seat belt safety
data of Table 7.1 also took into account the age of
the child involved in a fatal accident. The results
for those children wearing no seat belts are
shown on the next page. Here, X, = 1 if the child
did not survive and X, indicates the age in years.
(An age of zero implies that the child was less
Age
Survivors
Fatalities
104
127
1
165
91
2
267
107
3
277
90
4
316
94
than 1 year old, an age of 1 implies the child was
more than 1 year old but not yet 2, and so on.)
a Construct an approximate joint probability
distribution for X, and X2.
b Construct the conditional distribution of X, for
fixed values of X2. Discuss the implications of
these results.
c Construct the conditional distribution of X2 for
fixed values of X1. Are the implications the
same as in part (b)?
Expert Solution
This question has been solved!
Explore an expertly crafted, step-by-step solution for a thorough understanding of key concepts.

This is a popular solution!

Trending now
This is a popular solution!

Step by step
Solved in 4 steps

Knowledge Booster


Learn more about
Need a deep-dive on the concept behind this application? Look no further. Learn more about this topic, statistics and related others by exploring similar questions and additional content below.Recommended textbooks for you
MATLAB: An Introduction with Applications
Statistics
ISBN:
9781119256830
Author:
Amos Gilat
Publisher:
John Wiley & Sons Inc

Probability and Statistics for Engineering and th…
Statistics
ISBN:
9781305251809
Author:
Jay L. Devore
Publisher:
Cengage Learning

Statistics for The Behavioral Sciences (MindTap C…
Statistics
ISBN:
9781305504912
Author:
Frederick J Gravetter, Larry B. Wallnau
Publisher:
Cengage Learning
MATLAB: An Introduction with Applications
Statistics
ISBN:
9781119256830
Author:
Amos Gilat
Publisher:
John Wiley & Sons Inc
Probability and Statistics for Engineering and th…
Statistics
ISBN:
9781305251809
Author:
Jay L. Devore
Publisher:
Cengage Learning
Statistics for The Behavioral Sciences (MindTap C…
Statistics
ISBN:
9781305504912
Author:
Frederick J Gravetter, Larry B. Wallnau
Publisher:
Cengage Learning

Elementary Statistics: Picturing the World (7th E…
Statistics
ISBN:
9780134683416
Author:
Ron Larson, Betsy Farber
Publisher:
PEARSON

The Basic Practice of Statistics
Statistics
ISBN:
9781319042578
Author:
David S. Moore, William I. Notz, Michael A. Fligner
Publisher:
W. H. Freeman

Introduction to the Practice of Statistics
Statistics
ISBN:
9781319013387
Author:
David S. Moore, George P. McCabe, Bruce A. Craig
Publisher:
W. H. Freeman