The SCAL results for a core sample taken from an exploration well is as follows : Capillary pressure, P. (psia) Water saturation, (%) 100 Water density = 64 lb/ft3 %3D 4.4 100 Oil density = 45 lb/ft3 %3D 5.3 90.1 5.6 82.4 10.5 43.7 15.7 32.2 35.0 29.8 16.5 Dementa of Reservoir Rock and Fluid Properties Ch4-Saturation and Capilary Pressure Slide $1 15 Exercise A P U ASIA PACIFIC UNIVERITY L Convert the capillary pressure table to water saturation and height, Hin ft. Plot H vs Sw. IIndicate the FWL, OWC and transition zone on the plot. LA sample was taken from a depth 80 ft above the OWC. What is the expected Sw of the sample at that elevation.
The SCAL results for a core sample taken from an exploration well is as follows : Capillary pressure, P. (psia) Water saturation, (%) 100 Water density = 64 lb/ft3 %3D 4.4 100 Oil density = 45 lb/ft3 %3D 5.3 90.1 5.6 82.4 10.5 43.7 15.7 32.2 35.0 29.8 16.5 Dementa of Reservoir Rock and Fluid Properties Ch4-Saturation and Capilary Pressure Slide $1 15 Exercise A P U ASIA PACIFIC UNIVERITY L Convert the capillary pressure table to water saturation and height, Hin ft. Plot H vs Sw. IIndicate the FWL, OWC and transition zone on the plot. LA sample was taken from a depth 80 ft above the OWC. What is the expected Sw of the sample at that elevation.

Elements Of Electromagnetics
7th Edition
ISBN:9780190698614
Author:Sadiku, Matthew N. O.
Publisher:Sadiku, Matthew N. O.
ChapterMA: Math Assessment
Section: Chapter Questions
Problem 1.1MA

Related questions
Question
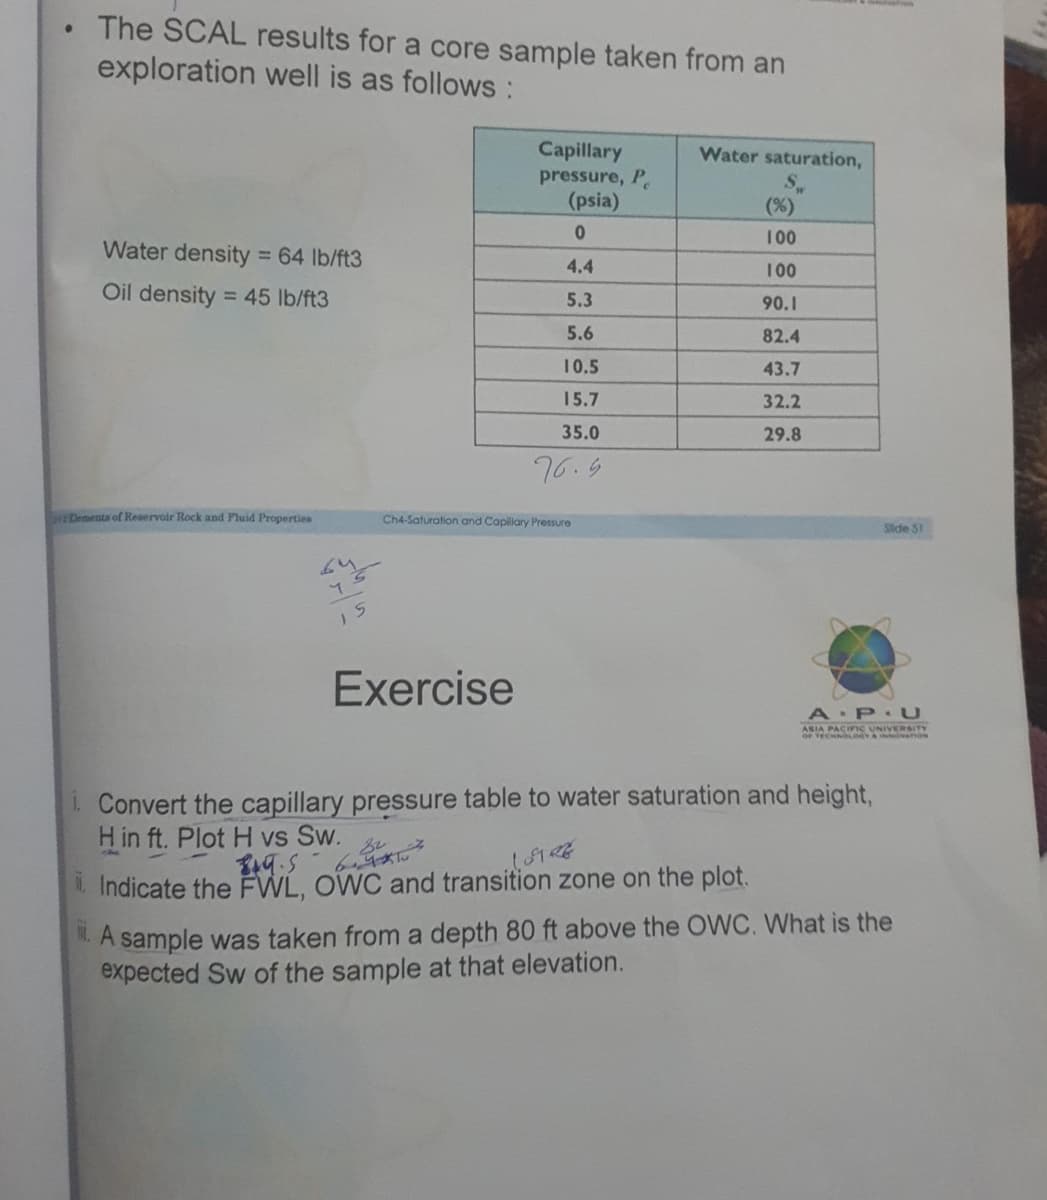
Transcribed Image Text:The SCAL results for a core sample taken from an
exploration well is as follows:
Capillary
pressure, P
(psia)
Water saturation,
(%)
100
Water density 64 lb/ft3
4.4
100
Oil density = 45 lb/ft3
%3D
5.3
90.1
5.6
82.4
10.5
43.7
15.7
32.2
35.0
29.8
76.5
Dementa of Reservoir Rock and Fluid Properties
Ch4-Saturation and Capilary Pressure
Slde 51
Exercise
A P U
ASIA PACInc UNIVERSITY
or TECHNOLOGYA ovanoN
L Convert the capillary pressure table to water saturation and height,
H in ft. Plot H vs Sw.
19.5
Indicate the FWL, OWC and transition zone on the plot.
LA sample was taken from a depth 80 ft above the OWC. What is the
expected Sw of the sample at that elevation.
Expert Solution
This question has been solved!
Explore an expertly crafted, step-by-step solution for a thorough understanding of key concepts.

Step by step
Solved in 3 steps with 1 images

Knowledge Booster


Learn more about
Need a deep-dive on the concept behind this application? Look no further. Learn more about this topic, mechanical-engineering and related others by exploring similar questions and additional content below.Recommended textbooks for you
Elements Of Electromagnetics
Mechanical Engineering
ISBN:
9780190698614
Author:
Sadiku, Matthew N. O.
Publisher:
Oxford University Press

Mechanics of Materials (10th Edition)
Mechanical Engineering
ISBN:
9780134319650
Author:
Russell C. Hibbeler
Publisher:
PEARSON

Thermodynamics: An Engineering Approach
Mechanical Engineering
ISBN:
9781259822674
Author:
Yunus A. Cengel Dr., Michael A. Boles
Publisher:
McGraw-Hill Education
Elements Of Electromagnetics
Mechanical Engineering
ISBN:
9780190698614
Author:
Sadiku, Matthew N. O.
Publisher:
Oxford University Press
Mechanics of Materials (10th Edition)
Mechanical Engineering
ISBN:
9780134319650
Author:
Russell C. Hibbeler
Publisher:
PEARSON
Thermodynamics: An Engineering Approach
Mechanical Engineering
ISBN:
9781259822674
Author:
Yunus A. Cengel Dr., Michael A. Boles
Publisher:
McGraw-Hill Education

Control Systems Engineering
Mechanical Engineering
ISBN:
9781118170519
Author:
Norman S. Nise
Publisher:
WILEY

Mechanics of Materials (MindTap Course List)
Mechanical Engineering
ISBN:
9781337093347
Author:
Barry J. Goodno, James M. Gere
Publisher:
Cengage Learning

Engineering Mechanics: Statics
Mechanical Engineering
ISBN:
9781118807330
Author:
James L. Meriam, L. G. Kraige, J. N. Bolton
Publisher:
WILEY